Credit Scoring: Which Personality Traits Predict Credit Risk?
We are sharing learnings about two personality traits that are central to risk assessment: impulsiveness and delayed gratification.

This is a guest post from Javier Frassetto, VP of Modeling and Data Science at FICO scoring partner EFL Global. EFL recently announced its merger with Lenddo. Our work with both EFL and Lenddo is part of the FICO Financial Inclusion Initiative.
Lenders rely on credit scoring to assess consumers’ risk, and credit scoring relies on credit data. But what if an applicant is new to credit?
EFL offers financial institutions a different way to assess creditworthiness and promote financial inclusion: by understanding personality. Everybody has a personality which can help us understand their risk profile, making the EFL assessment universal – we can score anyone.
To date, EFL has shared very little about the actual traits that drive our credit models. Today, we are sharing learnings about two traits that are central to risk assessment: impulsiveness and delayed gratification.
An Alternative to Credit Data
Over more than 10 years, EFL has developed a credit assessment using psychometric and behavioral science data that allows financial institutions to better understand applicants and make better credit decisions. The assessment is constantly evolving and improving. It started as a multiple-choice test taken with pen and paper and has become a gamified, digital assessment. The most recent version has a median completion time of 15 minutes and varies from 6 to 10 sections.There are two main challenges we face in using alternative data for credit assessment:
- Predictive power: The data provided must be able to differentiate between good and bad borrowers.
- Assessment time: As time increases, applicants’ attention decreases and productivity decreases for financial institutions.
- Maximum time limit – the assessment content has to be designed to have a maximum time associated with each exercise. This ensures a predictable timeframe for the assessment, easing the operational burden on financial institutions.
- Data-rich – each exercise has to capture multiple traits, relying heavily on metadata and interactions in order capture as much information in as little time as possible.
- Text light – content has to be designed with minimal text to ensure illiterate applicants are able to easily interact with the assessment.
Let’s take a look at two examples.
Impulsiveness
Impulsiveness, the trait of acting on impulse without thinking, is measured in many exercises within the EFL assessment. One clear way to see impulsiveness within the assessment is the Speed Match Exercise. In this module borrowers play an interactive game that involves quickly clicking through a series of images and selecting whether or not the image matches the previous image. (Original module design inspired by Sternberg et al. (2013) and Morrison et al. (2015).)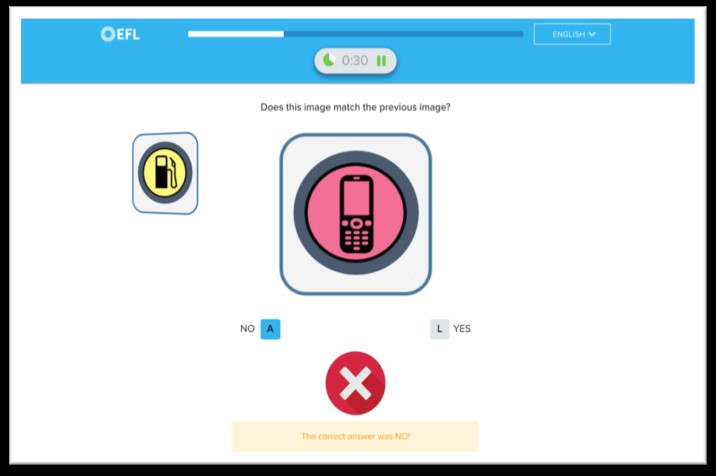
(This is just an example; in the real exercise the applicant only sees 1 image but not whether the choice was correct.)
Applicants are instructed to evaluate 20 images in a specific time window. This generates an environment where the applicant needs to decide whether to move faster and make mistakes, or move slower without making errors but not complete all 20 images.
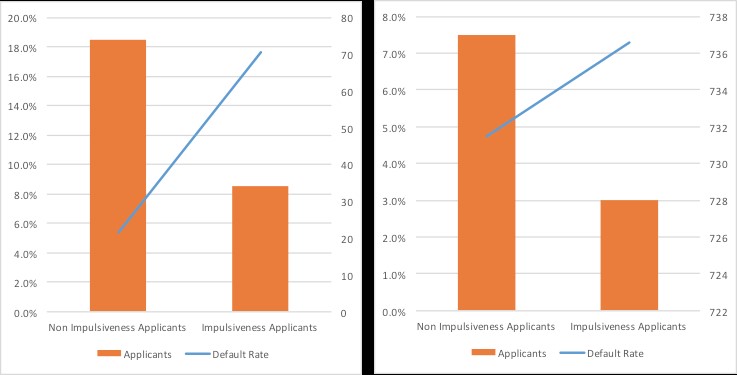
EFL data has shown that applicants who move faster with an impulse to finish the application and get wrong answers are more risky borrowers than those that take more time to answer with fewer errors. The figure below shows that impulsive applicants have higher default rates than other applicants. The relationship between the trait and default remains stable and the split between groups can be as high as three times. (Data comes from two different financial institutions in two countries where EFL has been deployed. The first chart is from a Latin-American country and the second one from an African country.)
Delayed Gratification
EFL measures delayed gratification, or the ability to delay something now in order to get something better in the future, through the financial trade-offs module. This module primarily estimates the customer’s temporal discount rate by measuring the amount of money she would be willing to forego to receive an immediate versus delayed payoff. Applicants demonstrate their financial preferences by making multiple selections between an immediate hypothetical reward and a larger delayed reward. (Module designed in partnership with Hal Hershfield (UCLA). Initial module design and estimate elicitations from Weber (2007), Weber et al (2013), and Meier and Sprenger (2010).)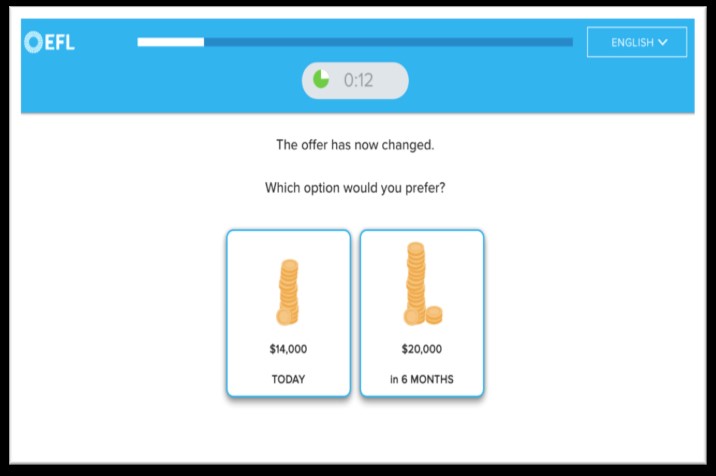
Discount rates are measured in different rounds for different delays. Temporal discount rate (as measured in the module) has been found to be correlated to things like savings rates, (not) smoking, healthy diets, and other "future-self" oriented behaviors.
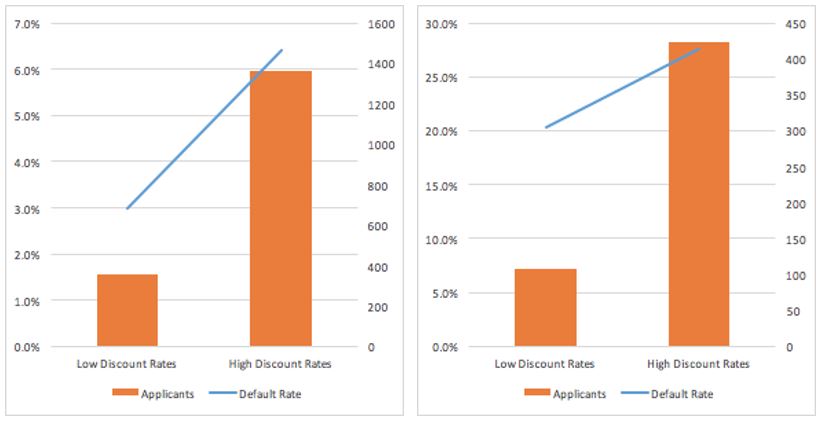
Data across different EFL deployments shows that applicants with higher discount rates are riskier than those with lower discount rates. Figure 2 shows how this exercise has been applied in two different populations. The first chart refers to an African population and the second one to a Latin-American population. Discount rates and default follow the same relationship and the split between groups can be as high as 2.1 times.
Opening the Door to Credit
Most of the time traits are not measured in just one exercise within the EFL credit assessment but in many across the assessment. These two examples show intuitively how different insights from an applicant can actually be used to predict credit risk.EFL’s models generally rely on 10-12 specific traits. We found that some populations reveal more information about themselves than others, which means our credit models work differently for different segments; however, when financial institutions are able to assess enough applicants, a sound predictive model can definitely be built.
By assessing impulsiveness and delayed gratification, two universally available traits, we can improve financial inclusion and open the door to financing for millions of people around the world — people who may lack a credit history but certainly have a personality to score.

Popular Posts

Average U.S. FICO® Score at 716, Indicating Improvement in Consumer Credit Behaviors Despite Pandemic
The FICO Score is a broad-based, independent standard measure of credit risk
Read more
The GSE Data Is Public. Here's What It Shows About Credit Score Modernization.
Independent Milliman analysis of GSE historical data confirms what anyone can now verify directly: FICO® Score 10T is the most predictive score.
Read more
FICO® Score High Achievers: Is Age the Only Factor?
<p>FICO’s latest research on <a href="http://www.fico.com/en/blogs/risk-compliance/us-credit-quality-rising-the-beat-goes-on/" target="_blank">national FICO® Score distribution</a> shows that US credit quality continues to trend upwards, with an increasing number of consumers scoring in the highest scores ranges. Given that, we decided it was time to refresh our study on “<a href="http://www.fico.com/en/blogs/risk-compliance/infographic-what-does-a-high-credit-scorer-look-like/" target="_blank">FICO® Score high achievers</a>,” where we examine the credit behavioural profiles of consumers with higher credit scores.</p> <p>As expected, our latest study showed that older people generally have higher scores, as has been the case in our <a href="http://www.fico.com/en/blogs/risk-compliance/age-before-beauty-credit-worthiness-before-youth/" target="_blank">past research</a>. This is largely because they have trade lines that have been open longer, which leads to higher scores (assuming the trade lines are in good standing and all other things equal). The most credit savvy among you will remember that length of credit history accounts for roughly 15% of the overall <a href="http://www.myfico.com/CreditEducation/WhatsInYourScore.aspx" target="_blank">FICO® Score calculation</a>.</p> <p>But for younger consumers, it isn’t too helpful to say, “just wait until you are 50 years old, and that will fix things!” Thus, I decided to dive deeper with our analysis, including looking at the credit behavioural characteristics of younger consumers with high FICO® Scores.</p> <p>In this analysis, I looked at credit characteristics for the two highest score bands, 750-799 and 800-850, which have about 16% and 23% of the population, respectively. I further broke this down by looking at the characteristics of the youngest 15% in each group, which occurs at age 29 for the 750-799 group and 43 for the 800-850. We used FICO<strong>®</strong> Score 9 for our analysis, and examined typical variables of the categories that go into the make-up of the score.</p> <p><a href="http://www.fico.com/en/blogs/wp-content/uploads/2016/10/FICO-Score-High-Achiever-table.png"><img class="alignnone size-full wp-image-29367" src="http://www.fico.com/en/blogs/wp-content/uploads/2016/10/FICO-Score-High-Achiever-table.png" alt="fico-score-high-achiever-table" width="715" height="747" /></a></p> <p>Since there’s a lot to dissect in this chart, I’ll highlight a few findings that struck me: <ul> <li><strong>Credit history.</strong> Higher scores are undoubtedly associated with a longer time on file. What’s striking is the higher average time on file for the 800+ group, both overall and for revolving accounts (the most common trade line). Clearly, it helps to start credit use early in life – but that’s not the sole determining factor for high scoring. The younger cohorts in both the 800+ and 750-799 groups have time on file medians significantly less than their older counterparts.</li> <li><strong>New credit.</strong> High credit scorers do, in fact, pursue new credit. We see little variation in months since last trade line opening and last inquiry among all groups observed.</li> <li><strong>Pay on time.</strong> As you might expect, the further in the past the delinquency, the higher the score – and that’s <u>if</u> a delinquency ever happened. 95% of the 800+ people and 72% of the 750-799 group have never been delinquent, which is a striking contrast to the 57% for the total population. The percentages for the younger groups are even higher, especially so for the 750-799ers. Collection items are also scarce for these high scorers. While 23% of the national population have collection items greater than $99, the figures are only 0.5% for the 800+ group and 3% for the 750-799 group. It is clear that, in conjunction with starting a credit file early, paying on time is a key trait of the FICO® Score high achiever.</li> <li><strong>Balance and utilization.</strong> Finally, we look at how credit is being used, focusing on revolving product use. (Since most people only have one mortgage or one auto loan, variation in instalment product figures is minimal and driven by payment history, which is near perfect for high scorers, as we’ve seen.) FICO® Score high achievers tend to have more open revolving accounts. While the % active trades and utilization are generally lower, by no means do high scorers avoid the use of credit products. What drives the difference here is the amount of <u>available</u> revolving credit utilized. The 800+ group is roughly 1/4 of the national median, both in total and on their highest utilized card; they also have lower balances and more cards<em>. </em>The 750-799 group is more active and higher utilized, but still only at 2/3 of the national figures. The young 750-799 group compensate with lower revolving balances and, as a result, lower utilization, which is in line with what we see for the 800+ group.</li> <li><strong>Benchmarks.</strong> I’d like to point out that while this study provides good benchmarks of the typical credit traits of the FICO® Score high achiever, individual credit profiles will vary widely. And keep in mind that when we sort groups of consumers as a whole by different behaviours, some results may look superficially odd. For example, the 800+ band has a longer median average open account time (128 months) than average revolving months on file (140 months).</li> </ul> So, what do we conclude? A huge takeaway is that high scorers don’t have too much in the way of serious delinquencies and negative public record data.</p> <p>In most respects, the young 800+ people are like their peer group. They really only differ markedly in their shorter credit history and higher non-mortgage balance, both of which are a function of life stage. Our results show that you don’t have to be a credit product hermit; these high scorers have more credit cards. The takeaway is to start credit activity early and maintain well-managed and moderate usage.</p> <p>In many ways, the young 750-799 people are more interesting because their age profile is much younger. Their credit characteristics differ more from their peer group, particularly in terms of length of credit history. They compensate by having almost pristine credit records and lower balances.</p> <p>Ultimately, 39% of US consumers are FICO® Score high achievers, which they accomplish by following common-sense credit practices. It ain’t rocket science!</p>
Read moreTake the next step
Connect with FICO for answers to all your product and solution questions. Interested in becoming a business partner? Contact us to learn more. We look forward to hearing from you.