Addressing Portfolio Risk in Economic Uncertainty: Part 3 (2022)
Building portfolio risk resilience into customer management

We all purchase insurance policies for one fundamental reason – to protect and manage our valuable assets against unexpected events. No one plans to have an automobile accident or to have a tree fall on their home, and insurance provides valuable peace of mind that, should significant unexpected events such as these occur, they don’t translate into financial hardships or major life disruptions. Lenders must adopt a similar mindset as they manage the financial health of their consumer lending portfolios to insulate their existing assets from potential portfolio risk volatility.
As we discussed in part 1 of this blog series, FICO® Resilience Index (FRI) was designed with precisely this capability in mind. Leveraging FICO Resilience Index to refine credit risk management decisions during benign economic phases defends against dramatic swings in delinquency rates and provides for a more consistent portfolio risk management approach over time.
During the pandemic, systemic financial assistance programs such as federal stimulus payments and the availability of lender-provided payment accommodations undoubtedly prevented and helped manage the dramatic increases in delinquencies and losses we witnessed in 2008-9. Impressively, the Federal Reserve reported Q1 2022 delinquency rates on all consumer loans of 1.63%, one of the lowest marks in the 35+ years it has been tracked. Despite this good news, many remain concerned that the pendulum will eventually swing in the opposite direction, especially given recent economic challenges on multiple fronts (e.g., inflation, geopolitical instability, ongoing supply chain issues). Indeed, Q3 2022 delinquency rates already appear to reflect some additional credit risk, having increased to 1.92% on all consumer loans, still lower than any pre-pandemic rate on record.
Of course, credit risk management is only one aspect of portfolio health. For revolving credit portfolios in particular, proper attention must be directed toward maintaining asset and revenue growth. As was the tactic during the Great Recession, lender credit risk management response in early 2020 – with few exceptions – was a full cessation of credit limit increases, balance transfer offers, and other spend incentive programs. The result was further downward pressure on an already cautious consumer spending climate during the pandemic, waning portfolio assets and, along with them, significant reductions in interest and non-interest income that had many lenders grappling with the idea of aggressive spend stimulus programs.
Leveraging FICO® Resilience Index can help improve revolving account portfolio exposure management strategies by balancing the need to manage portfolio credit risk in the face of economic uncertainty while encouraging healthy asset growth. By constraining credit exposure across more sensitive customer segments, the delinquency impacts associated with unexpected economic downturns can be mitigated. At the same time, uninterrupted credit limit increase programs coupled with spend incentives to the most resilient segments can help promote and manage usage, asset, and revenue growth.
Two-layered risk appetite approach to customer management without FICO® Resilience Index
To carry the use case forward a bit, let’s first consider exposure portfolio management in an unstressed environment. As we discussed in part 2 of this blog series, which focused on customer acquisition risk management decisions, lenders may choose to take a two-layered risk appetite approach. For example, recognizing that downturns are a regular part of the economic cycle, a portfolio risk manager may define a target population for limit increases as customer segments with expected default rates below X% and stressed default rates below Y%. For the sake of our credit limit increase illustration, let’s suppose the stated risk appetite requires default rates below 5% during a benign economy and below 7% during stressed economic conditions.
Based on observed industry-wide 90+ days past due default rates for bankcard account management during benign and stressed economic periods (Figure 1), our example risk appetite would mean raising the “normal” credit limit increase inclusion FICO® Score cutoff from 680 to 720.
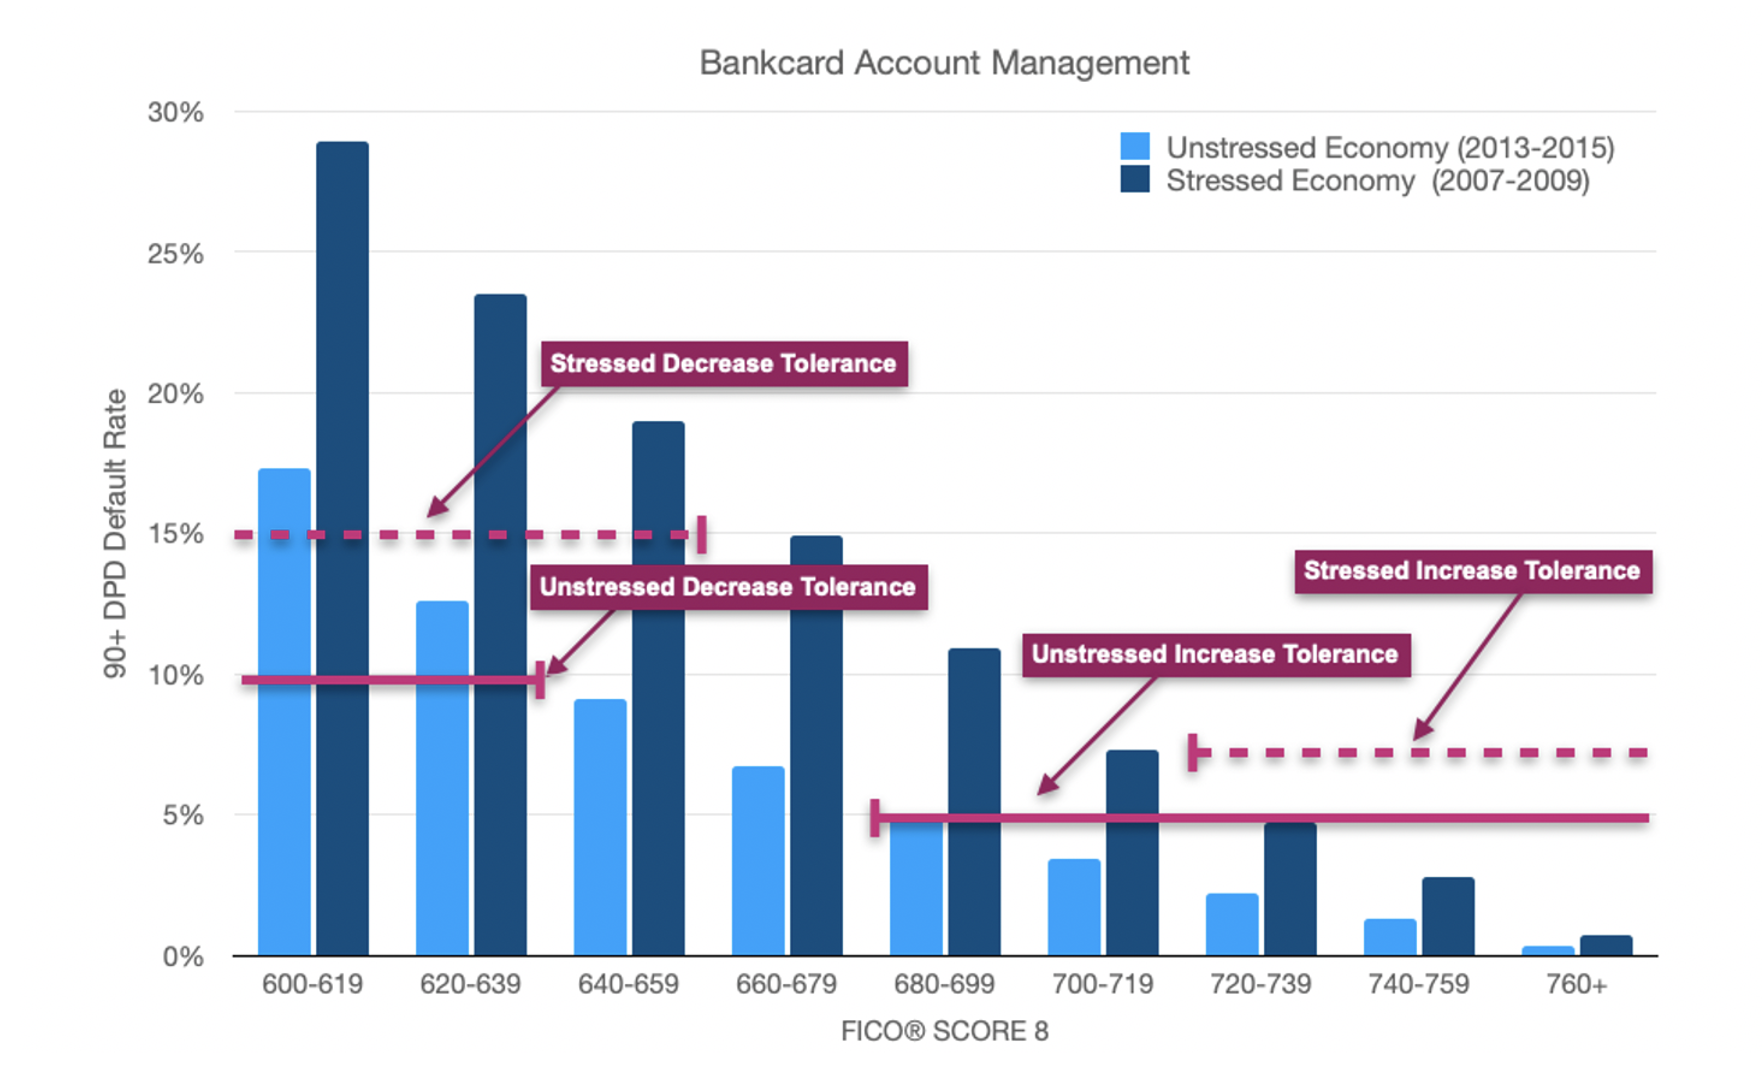
Figure 1: Bankcard account management default rates by FICO® Score 8, Oct 13-Oct 15 versus Oct 07-Oct 09.
Expanding our exposure management illustration to include credit limit decreases, suppose the stated risk appetite is account default rates above 10% during a benign economy or above 15% during stressed economic conditions. Using a two-layered risk appetite statement would mean raising the “normal” limit decrease inclusion FICO® Score cutoff from below 640 to below 660.
Introducing different levels of credit limit increases and decreases, the complete range of customer risk management treatments by risk appetite may be expressed as shown in Figure 2. The highest risk customers are targeted for credit limit decreases either to their existing balance or by trimming 50% of their existing available credit, or “open-to-buy” (OTB). Credit limits within moderate risk ranges are unchanged while low risk segments qualify for different tiers of credit limit increase amounts.
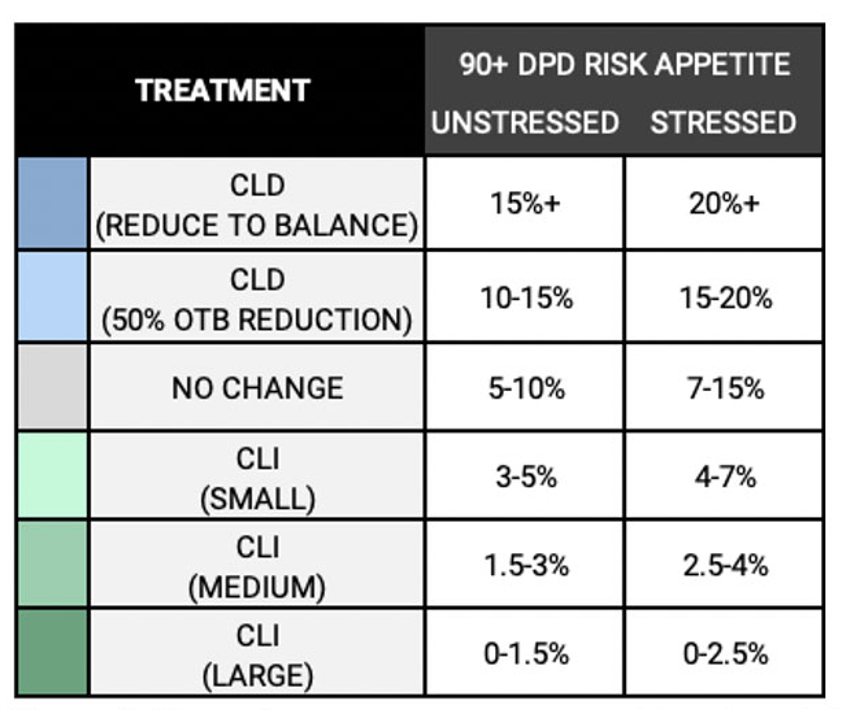
Figure 2: Example credit limit exposure management treatments by risk appetite.
Applying this strategy to a portfolio with the projected unstressed and stressed economy default rates shown in Figure 3 yields a range of limit increase and decrease actions. The final “dominant” treatment is based on the more restrictive action associated with the FICO® Score band. Here, the more restrictive actions happen to align to those from the stressed scenario, but this may vary depending on the risk appetite statement and the default rates by FICO Score band in each scenario.
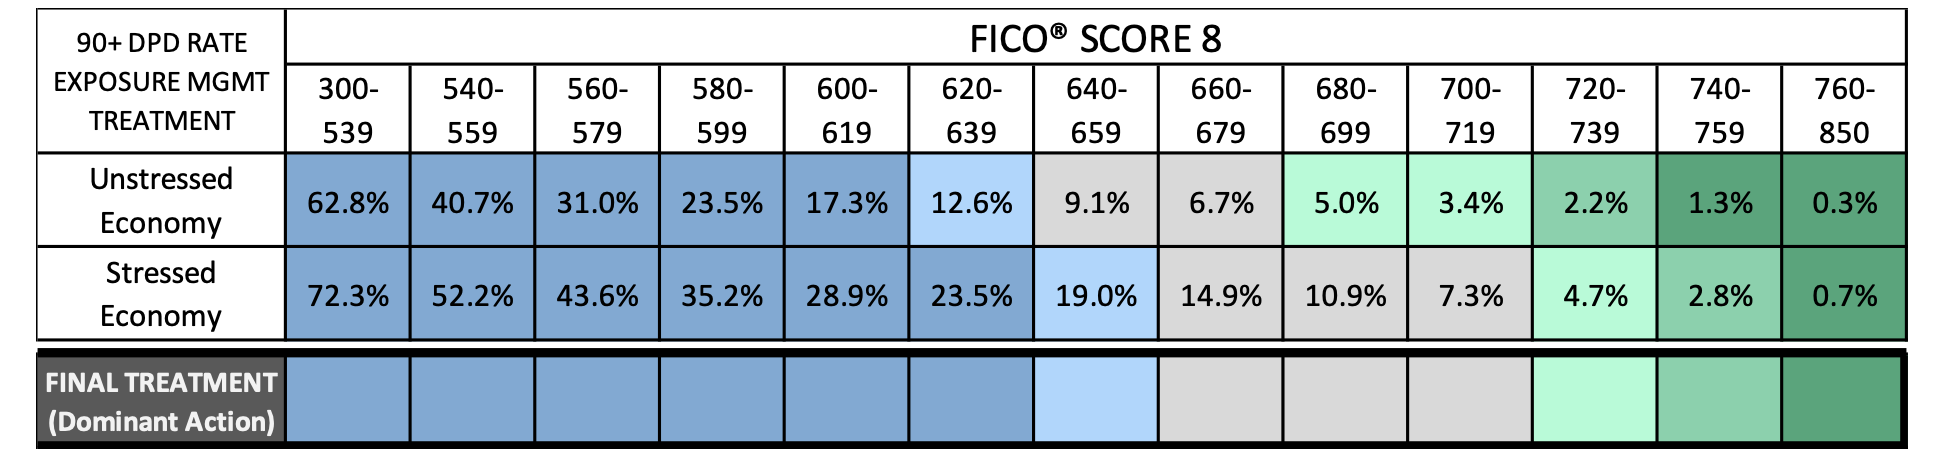
Figure 3: Exposure risk management treatment approach based on FICO® Score 8 only. Cell values represent bankcard account management 90+ days past due default rates by FICO Score 8, unstressed economy (Oct 13-Oct 15) versus stressed economy (Oct 07-Oct 09).
Two-layered risk appetite approach to customer management including FICO® Resilience Index
Factoring in FICO® Resilience Index makes our illustrated exposure management treatment significantly more informed and targeted. The table in Figure 4 shows account default rates during an unstressed economy by both FICO® Score and FICO Resilience Index. Again, credit limit management actions are allocated according to our stated risk appetite during an unstressed economy.
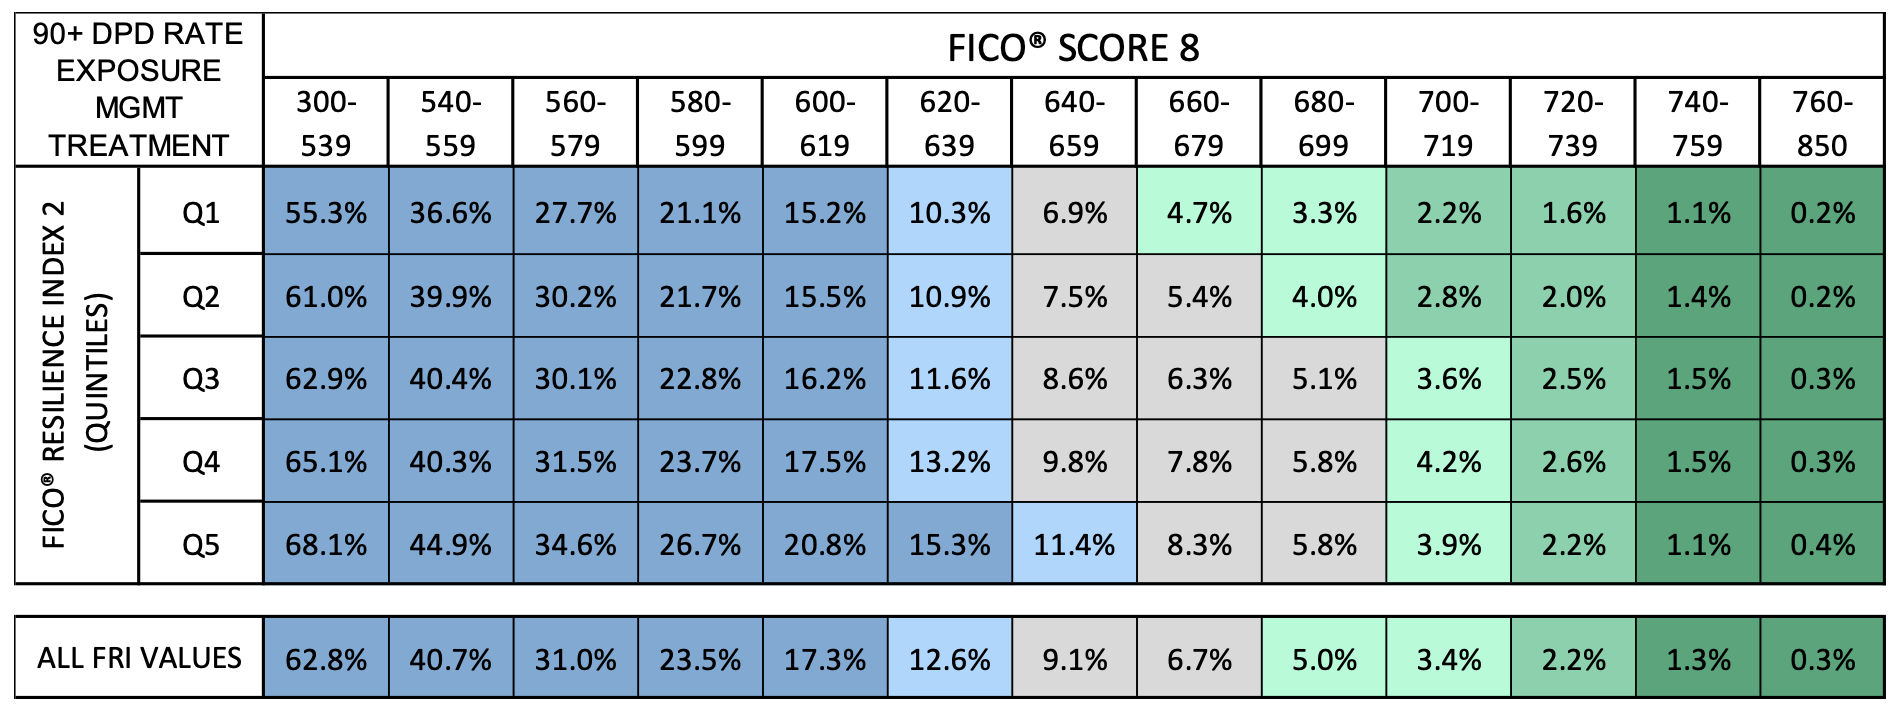
Figure 4: Exposure management treatment approach based on FICO® Score 8 and FICO® Resilience Index 2. Cell values represent bankcard account management 90+ days past due default rates by FICO Score 8 and FICO Resilience Index 2 during an unstressed economy (Oct 13-Oct 15).
Figure 5 repeats the above exercise, but this time we apply the approach to the stressed economic period.
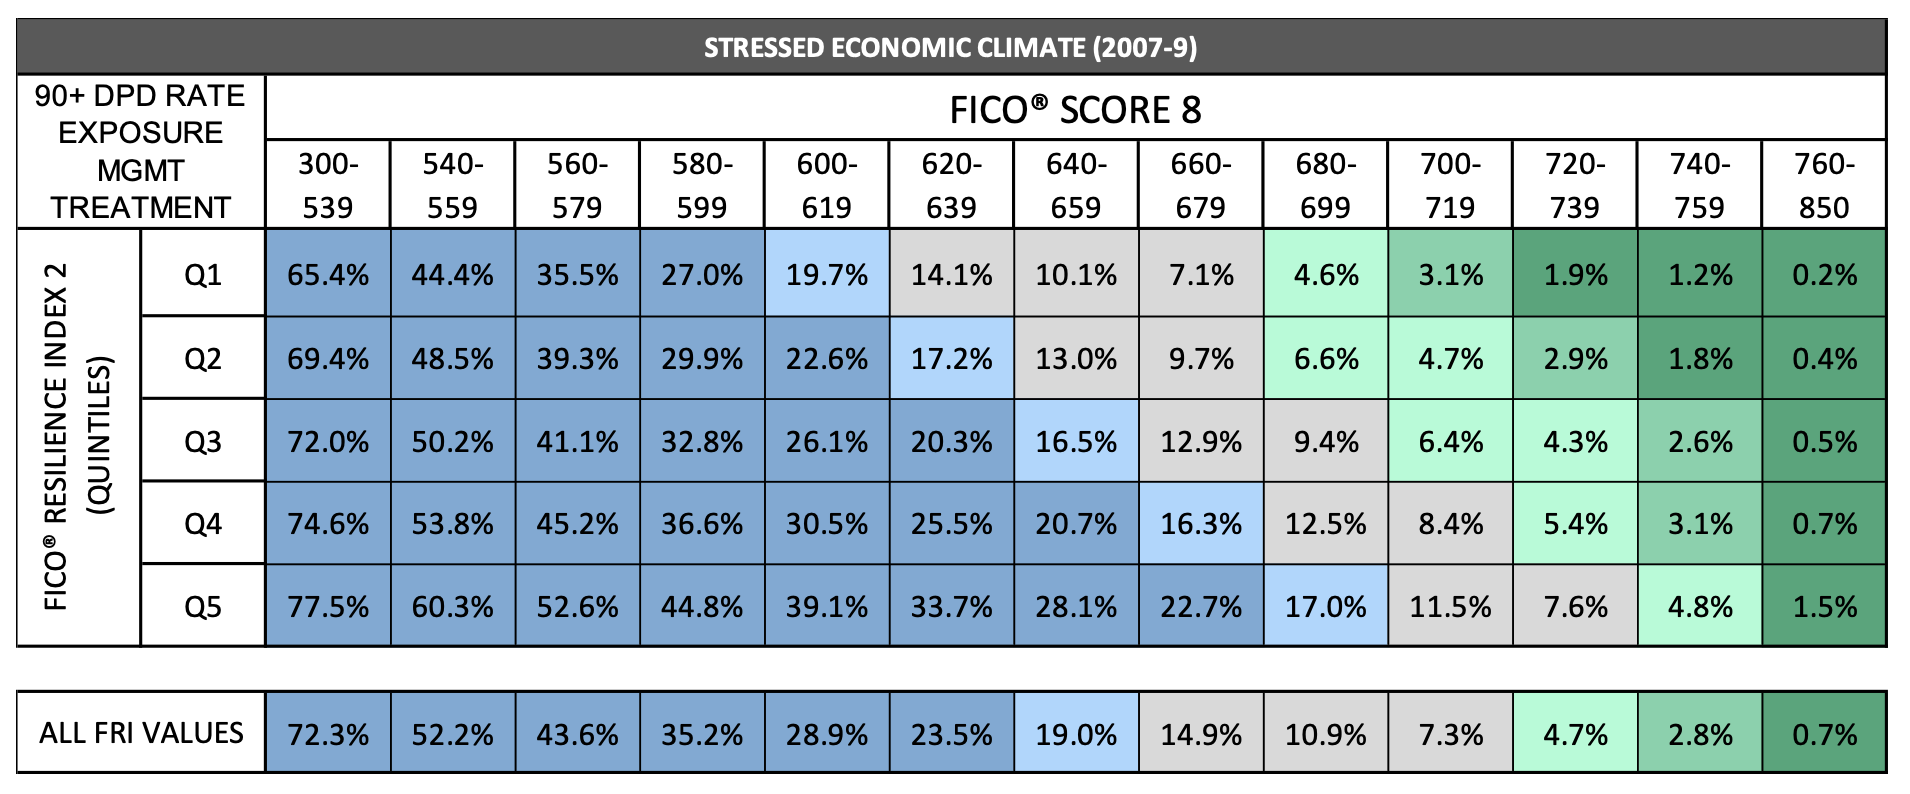
Figure 5: Exposure management treatment approach based on FICO® Score 8 and FICO® Resilience Index 2. Cell values represent bankcard account management 90+ days past due default rates by FICO Score 8 and FICO Resilience Index 2 during a stressed economy (Oct 07-Oct 09).
Finally, our illustration of the combined, or two-layered, risk appetite statement identifies the target populations that meet the required criteria for both the unstressed and stressed economy treatment approaches. Again, the dominant treatment is based on the more restrictive action associated with the FICO® Score band and FICO® Resilience Index quintile between the unstressed and stressed economic scenarios. Figure 6 summarizes the combined credit exposure treatment approach and highlights the shift in credit limit allocation through swap in/out groups and segments that receive a more generous or restrictive action as compared to the original FICO Score-based strategy approach.
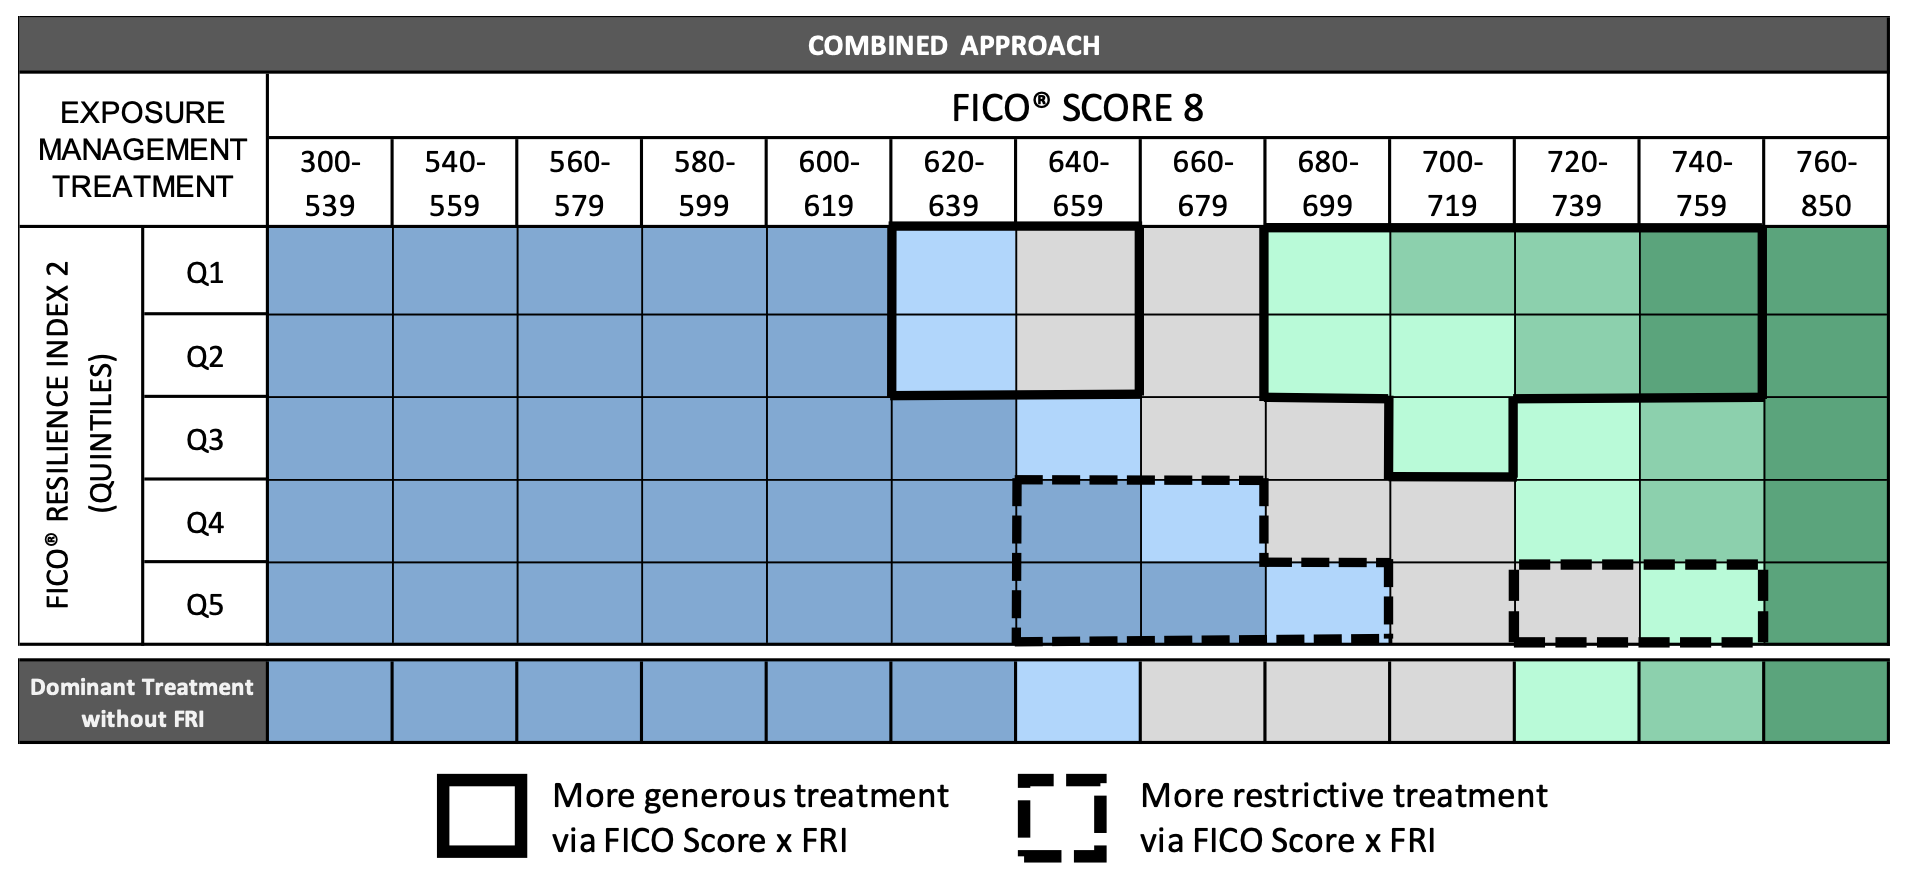
Figure 6: Bankcard exposure management strategy reflecting two-layered risk appetite statement based on FICO® Score 8 and FICO® Resilience Index 2.
Leveraging this approach over time, based on your own risk appetite, enhances portfolio risk resilience by reducing exposure to sensitive customers whose performance would markedly deteriorate during economic downturns while favoring resilient customers whose performance would be more stable through such troubled times.
Relevance to other customer risk management decisions
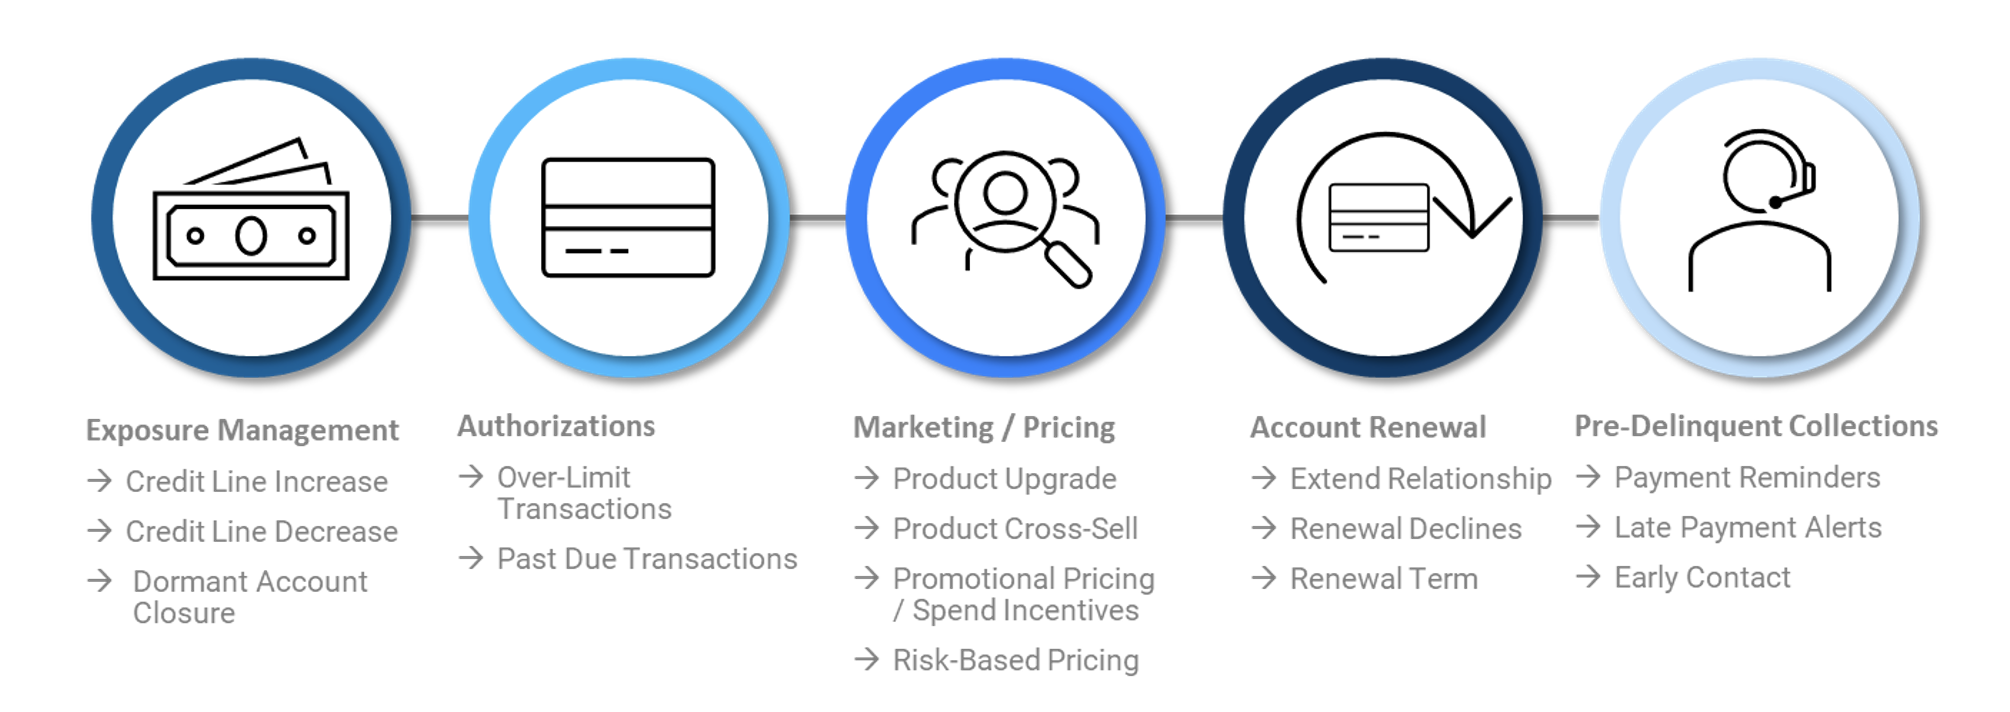
Nearly any risk-based decision may be improved by considering the degree to which a stressed economic climate is likely to impact a consumer’s ability to repay their debts. In addition to improving portfolio exposure management decisions as illustrated above, FICO® Resilience Index can enhance numerous other customer management decisions (Figure 7), such as:
- Authorizations – Refine transaction approval and decline decisions for over-the-limit transactions based on customer resilience.
- Marketing / Pricing – Target spend incentive campaigns that favor more resilient customer segments. Promote usage and loyalty via product upgrades and deepen customer relationships across the portfolio via cross-sell campaigns to more resilient customers.
- Account Renewal – Adjust renewal decisions in customer portfolio segments based on likelihood of negative performance during economic downturns.
- Pre-Delinquent Collections – Accelerate collections efforts at the missed payment due for customers who are deemed sensitive based on FICO® Resilience Index. Target resilient customer portfolio segments with non-invasive courtesy notifications via digital outreach.
Please visit the FICO Blog to find all four parts of this series and to keep up to date on all of FICO’s latest insights and offerings.
To gain more background about the FICO® Resilience Index, please visit https://www.fico.com/en/products/fico-resilience-index.
1 “Delinquency Rate on Consumer Loans, All Commercial Banks.” FRED, 16 August 2022, http://fred.stlouisfed.org/series/DRCLACBS.
This blog is co-authored with David Binder, Senior Director of Scores Product Management.

Popular Posts

Average U.S. FICO® Score at 716, Indicating Improvement in Consumer Credit Behaviors Despite Pandemic
The FICO Score is a broad-based, independent standard measure of credit risk
Read more
The GSE Data Is Public. Here's What It Shows About Credit Score Modernization.
Independent Milliman analysis of GSE historical data confirms what anyone can now verify directly: FICO® Score 10T is the most predictive score.
Read more
FICO® Score High Achievers: Is Age the Only Factor?
<p>FICO’s latest research on <a href="http://www.fico.com/en/blogs/risk-compliance/us-credit-quality-rising-the-beat-goes-on/" target="_blank">national FICO® Score distribution</a> shows that US credit quality continues to trend upwards, with an increasing number of consumers scoring in the highest scores ranges. Given that, we decided it was time to refresh our study on “<a href="http://www.fico.com/en/blogs/risk-compliance/infographic-what-does-a-high-credit-scorer-look-like/" target="_blank">FICO® Score high achievers</a>,” where we examine the credit behavioural profiles of consumers with higher credit scores.</p> <p>As expected, our latest study showed that older people generally have higher scores, as has been the case in our <a href="http://www.fico.com/en/blogs/risk-compliance/age-before-beauty-credit-worthiness-before-youth/" target="_blank">past research</a>. This is largely because they have trade lines that have been open longer, which leads to higher scores (assuming the trade lines are in good standing and all other things equal). The most credit savvy among you will remember that length of credit history accounts for roughly 15% of the overall <a href="http://www.myfico.com/CreditEducation/WhatsInYourScore.aspx" target="_blank">FICO® Score calculation</a>.</p> <p>But for younger consumers, it isn’t too helpful to say, “just wait until you are 50 years old, and that will fix things!” Thus, I decided to dive deeper with our analysis, including looking at the credit behavioural characteristics of younger consumers with high FICO® Scores.</p> <p>In this analysis, I looked at credit characteristics for the two highest score bands, 750-799 and 800-850, which have about 16% and 23% of the population, respectively. I further broke this down by looking at the characteristics of the youngest 15% in each group, which occurs at age 29 for the 750-799 group and 43 for the 800-850. We used FICO<strong>®</strong> Score 9 for our analysis, and examined typical variables of the categories that go into the make-up of the score.</p> <p><a href="http://www.fico.com/en/blogs/wp-content/uploads/2016/10/FICO-Score-High-Achiever-table.png"><img class="alignnone size-full wp-image-29367" src="http://www.fico.com/en/blogs/wp-content/uploads/2016/10/FICO-Score-High-Achiever-table.png" alt="fico-score-high-achiever-table" width="715" height="747" /></a></p> <p>Since there’s a lot to dissect in this chart, I’ll highlight a few findings that struck me: <ul> <li><strong>Credit history.</strong> Higher scores are undoubtedly associated with a longer time on file. What’s striking is the higher average time on file for the 800+ group, both overall and for revolving accounts (the most common trade line). Clearly, it helps to start credit use early in life – but that’s not the sole determining factor for high scoring. The younger cohorts in both the 800+ and 750-799 groups have time on file medians significantly less than their older counterparts.</li> <li><strong>New credit.</strong> High credit scorers do, in fact, pursue new credit. We see little variation in months since last trade line opening and last inquiry among all groups observed.</li> <li><strong>Pay on time.</strong> As you might expect, the further in the past the delinquency, the higher the score – and that’s <u>if</u> a delinquency ever happened. 95% of the 800+ people and 72% of the 750-799 group have never been delinquent, which is a striking contrast to the 57% for the total population. The percentages for the younger groups are even higher, especially so for the 750-799ers. Collection items are also scarce for these high scorers. While 23% of the national population have collection items greater than $99, the figures are only 0.5% for the 800+ group and 3% for the 750-799 group. It is clear that, in conjunction with starting a credit file early, paying on time is a key trait of the FICO® Score high achiever.</li> <li><strong>Balance and utilization.</strong> Finally, we look at how credit is being used, focusing on revolving product use. (Since most people only have one mortgage or one auto loan, variation in instalment product figures is minimal and driven by payment history, which is near perfect for high scorers, as we’ve seen.) FICO® Score high achievers tend to have more open revolving accounts. While the % active trades and utilization are generally lower, by no means do high scorers avoid the use of credit products. What drives the difference here is the amount of <u>available</u> revolving credit utilized. The 800+ group is roughly 1/4 of the national median, both in total and on their highest utilized card; they also have lower balances and more cards<em>. </em>The 750-799 group is more active and higher utilized, but still only at 2/3 of the national figures. The young 750-799 group compensate with lower revolving balances and, as a result, lower utilization, which is in line with what we see for the 800+ group.</li> <li><strong>Benchmarks.</strong> I’d like to point out that while this study provides good benchmarks of the typical credit traits of the FICO® Score high achiever, individual credit profiles will vary widely. And keep in mind that when we sort groups of consumers as a whole by different behaviours, some results may look superficially odd. For example, the 800+ band has a longer median average open account time (128 months) than average revolving months on file (140 months).</li> </ul> So, what do we conclude? A huge takeaway is that high scorers don’t have too much in the way of serious delinquencies and negative public record data.</p> <p>In most respects, the young 800+ people are like their peer group. They really only differ markedly in their shorter credit history and higher non-mortgage balance, both of which are a function of life stage. Our results show that you don’t have to be a credit product hermit; these high scorers have more credit cards. The takeaway is to start credit activity early and maintain well-managed and moderate usage.</p> <p>In many ways, the young 750-799 people are more interesting because their age profile is much younger. Their credit characteristics differ more from their peer group, particularly in terms of length of credit history. They compensate by having almost pristine credit records and lower balances.</p> <p>Ultimately, 39% of US consumers are FICO® Score high achievers, which they accomplish by following common-sense credit practices. It ain’t rocket science!</p>
Read moreTake the next step
Connect with FICO for answers to all your product and solution questions. Interested in becoming a business partner? Contact us to learn more. We look forward to hearing from you.