Average U.S. FICO® Score at 716, Indicating Improvement in Consumer Credit Behaviors Despite Pandemic
The FICO Score is a broad-based, independent standard measure of credit risk

The FICO® Score is the lingua franca, or common language, for the credit scoring industry. It serves as a broad-based, independent standard measure of credit risk. It is relied upon by stakeholders across the entire lending ecosystem – from regulators, investors and boards to consumers, lenders, and brokers – as a baseline metric for assessing credit risk that is fair to both lenders and consumers.
The FICO® Score model is based on data in an individual’s credit report, housed by the three primary U.S. consumer reporting agencies (CRAs). There are also FICO Score versions available that utilize alternative data, based on Fair Credit Reporting Act (FCRA) compliant sources such as landline, mobile and cable payments; these scores can help address populations that were previously unable to be scored due to their sparse traditional CRA credit data.
FICO Scores, which range from 300-850, are dynamic and evolve based on continually changing consumer behavior reported to the CRAs.*
The Average U.S. FICO® Score Continues to Rise
Each year, we share the average U.S. FICO® Score, which now stands at 716. This is eight points higher than it was one year ago, and five points higher than the last time we reported on the average FICO Score in October 2020. At that time, the news that the FICO Score had trended up in the early months of the COVID-19 pandemic was greeted with some surprise. But there is considerably less surprise about these latest results: the data shows that a growing economy, accompanied by historic home price appreciation, strong performance of equity markets, and evidence that the payment accommodation programs offered by lenders since the onset of the pandemic have helped (and are continuing to help) affected borrowers bridge the gap that opened up in their finances as a result of COVID-related income loss.
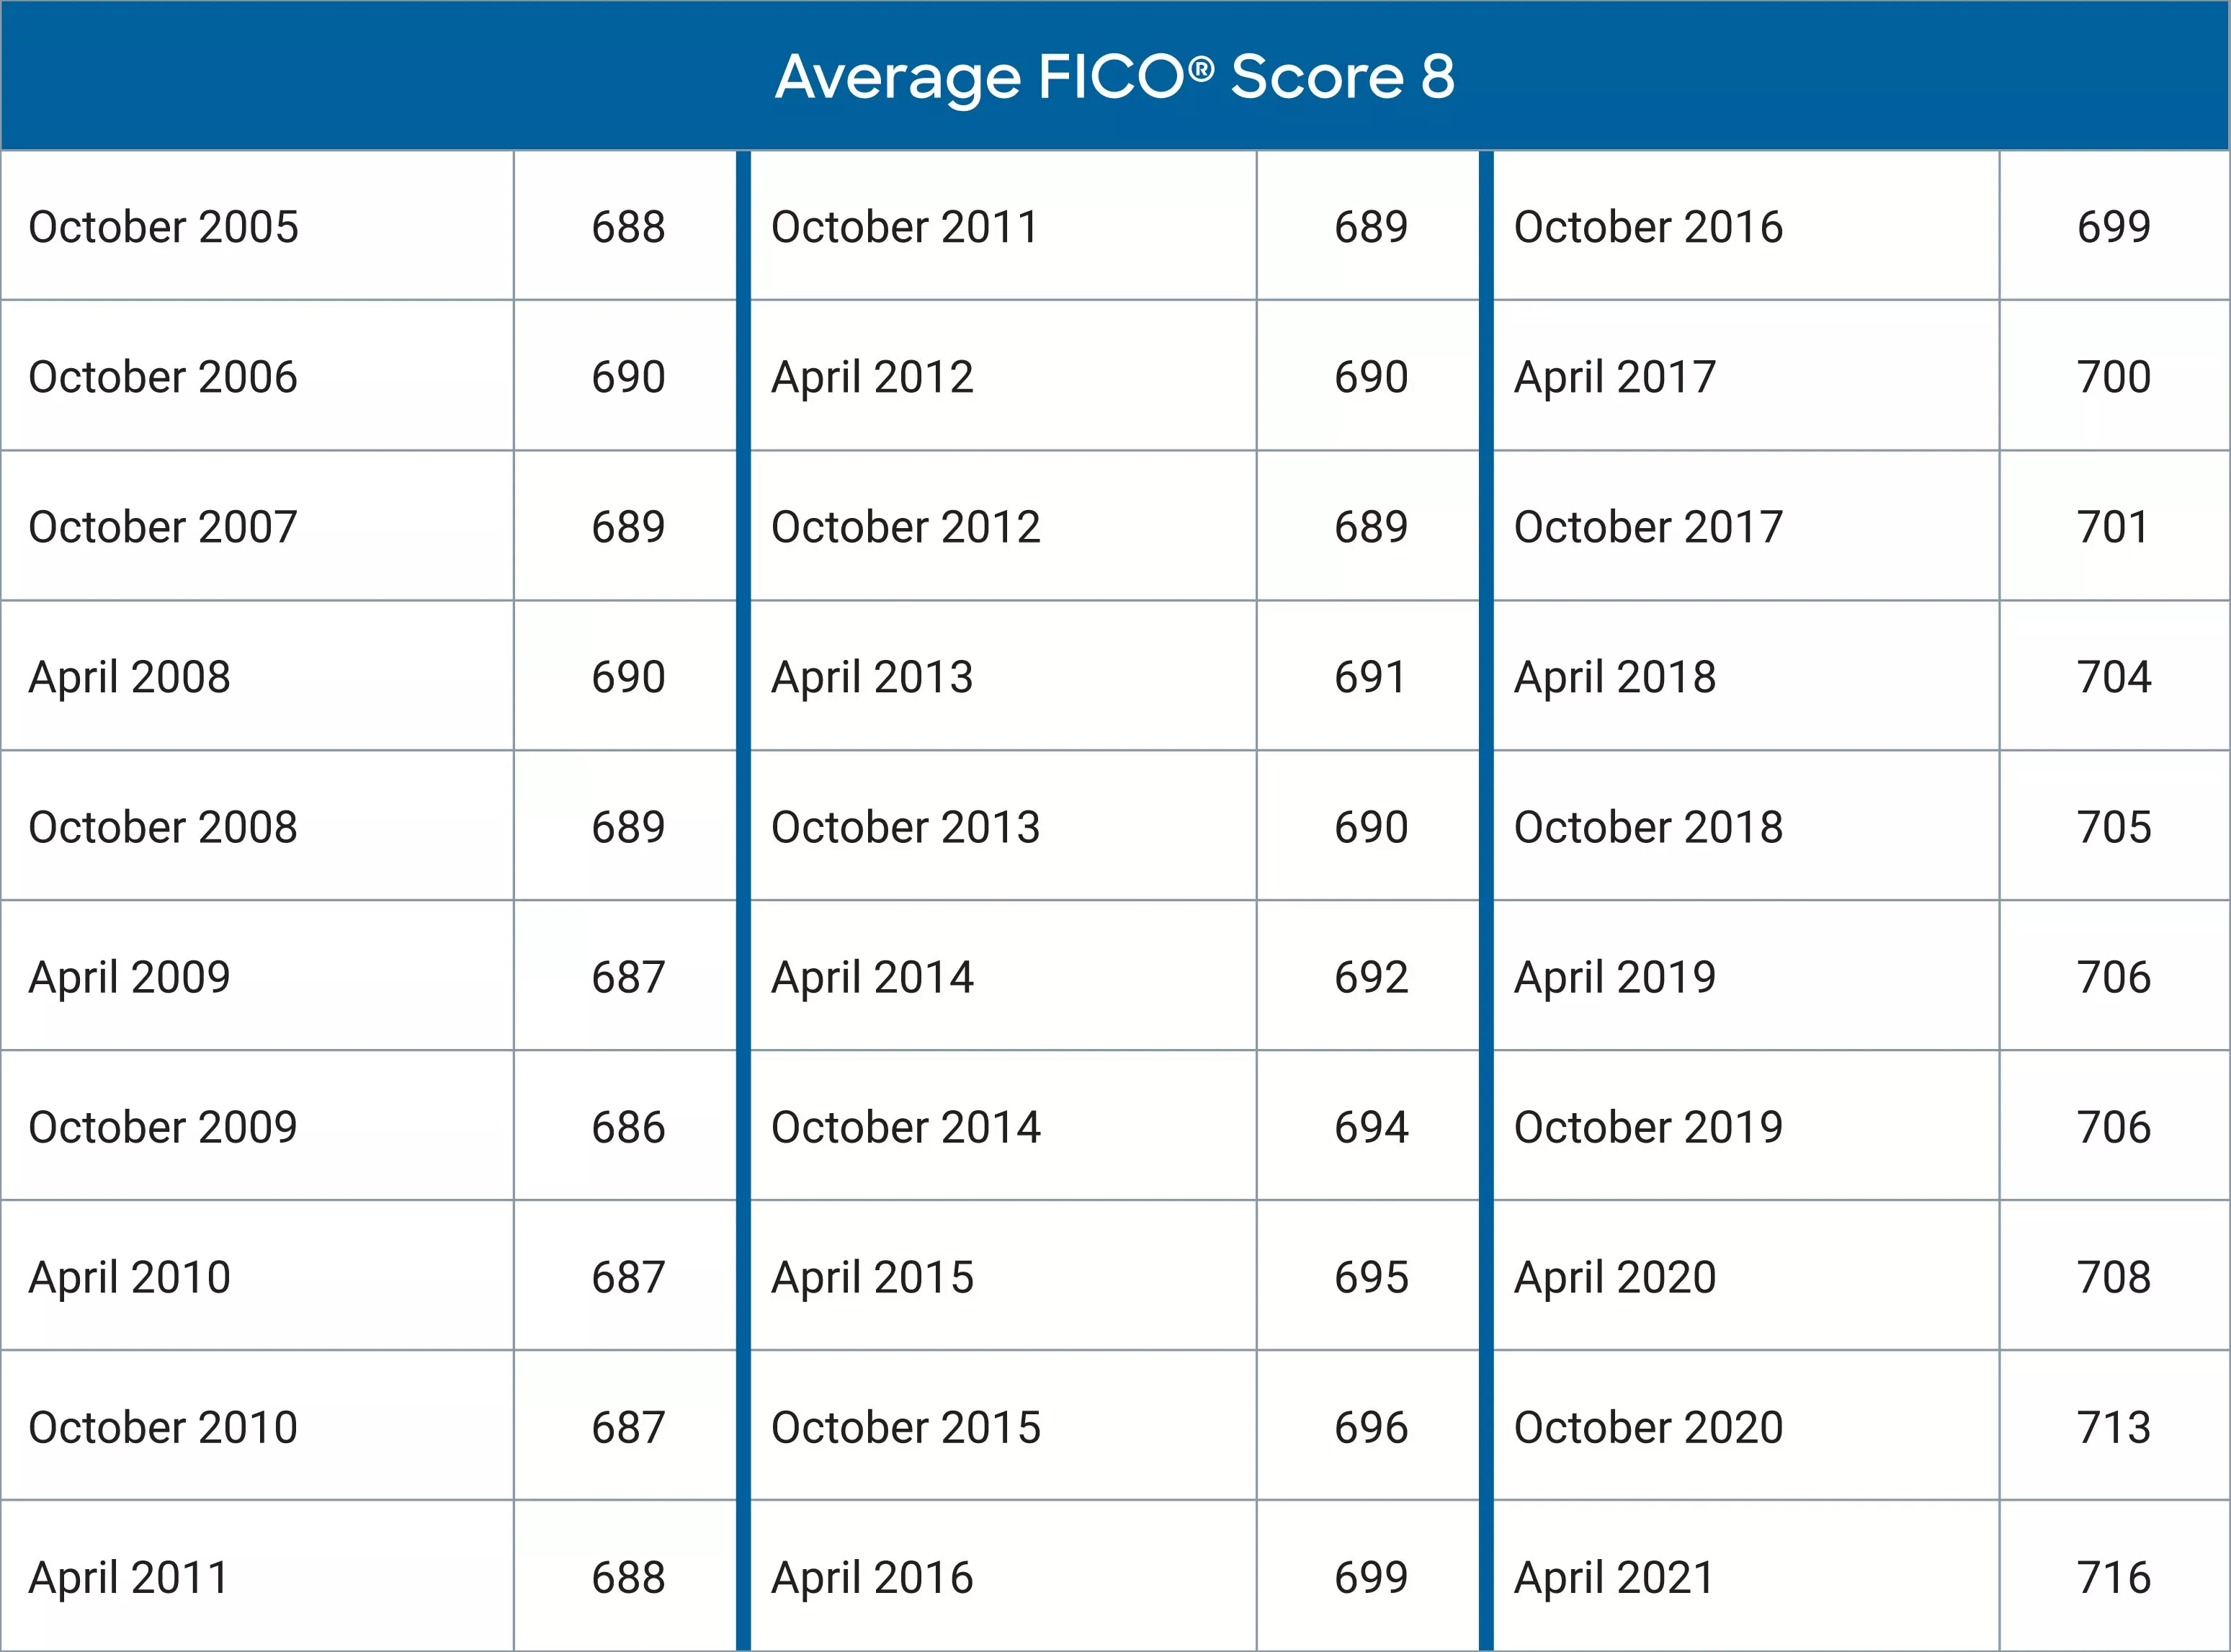
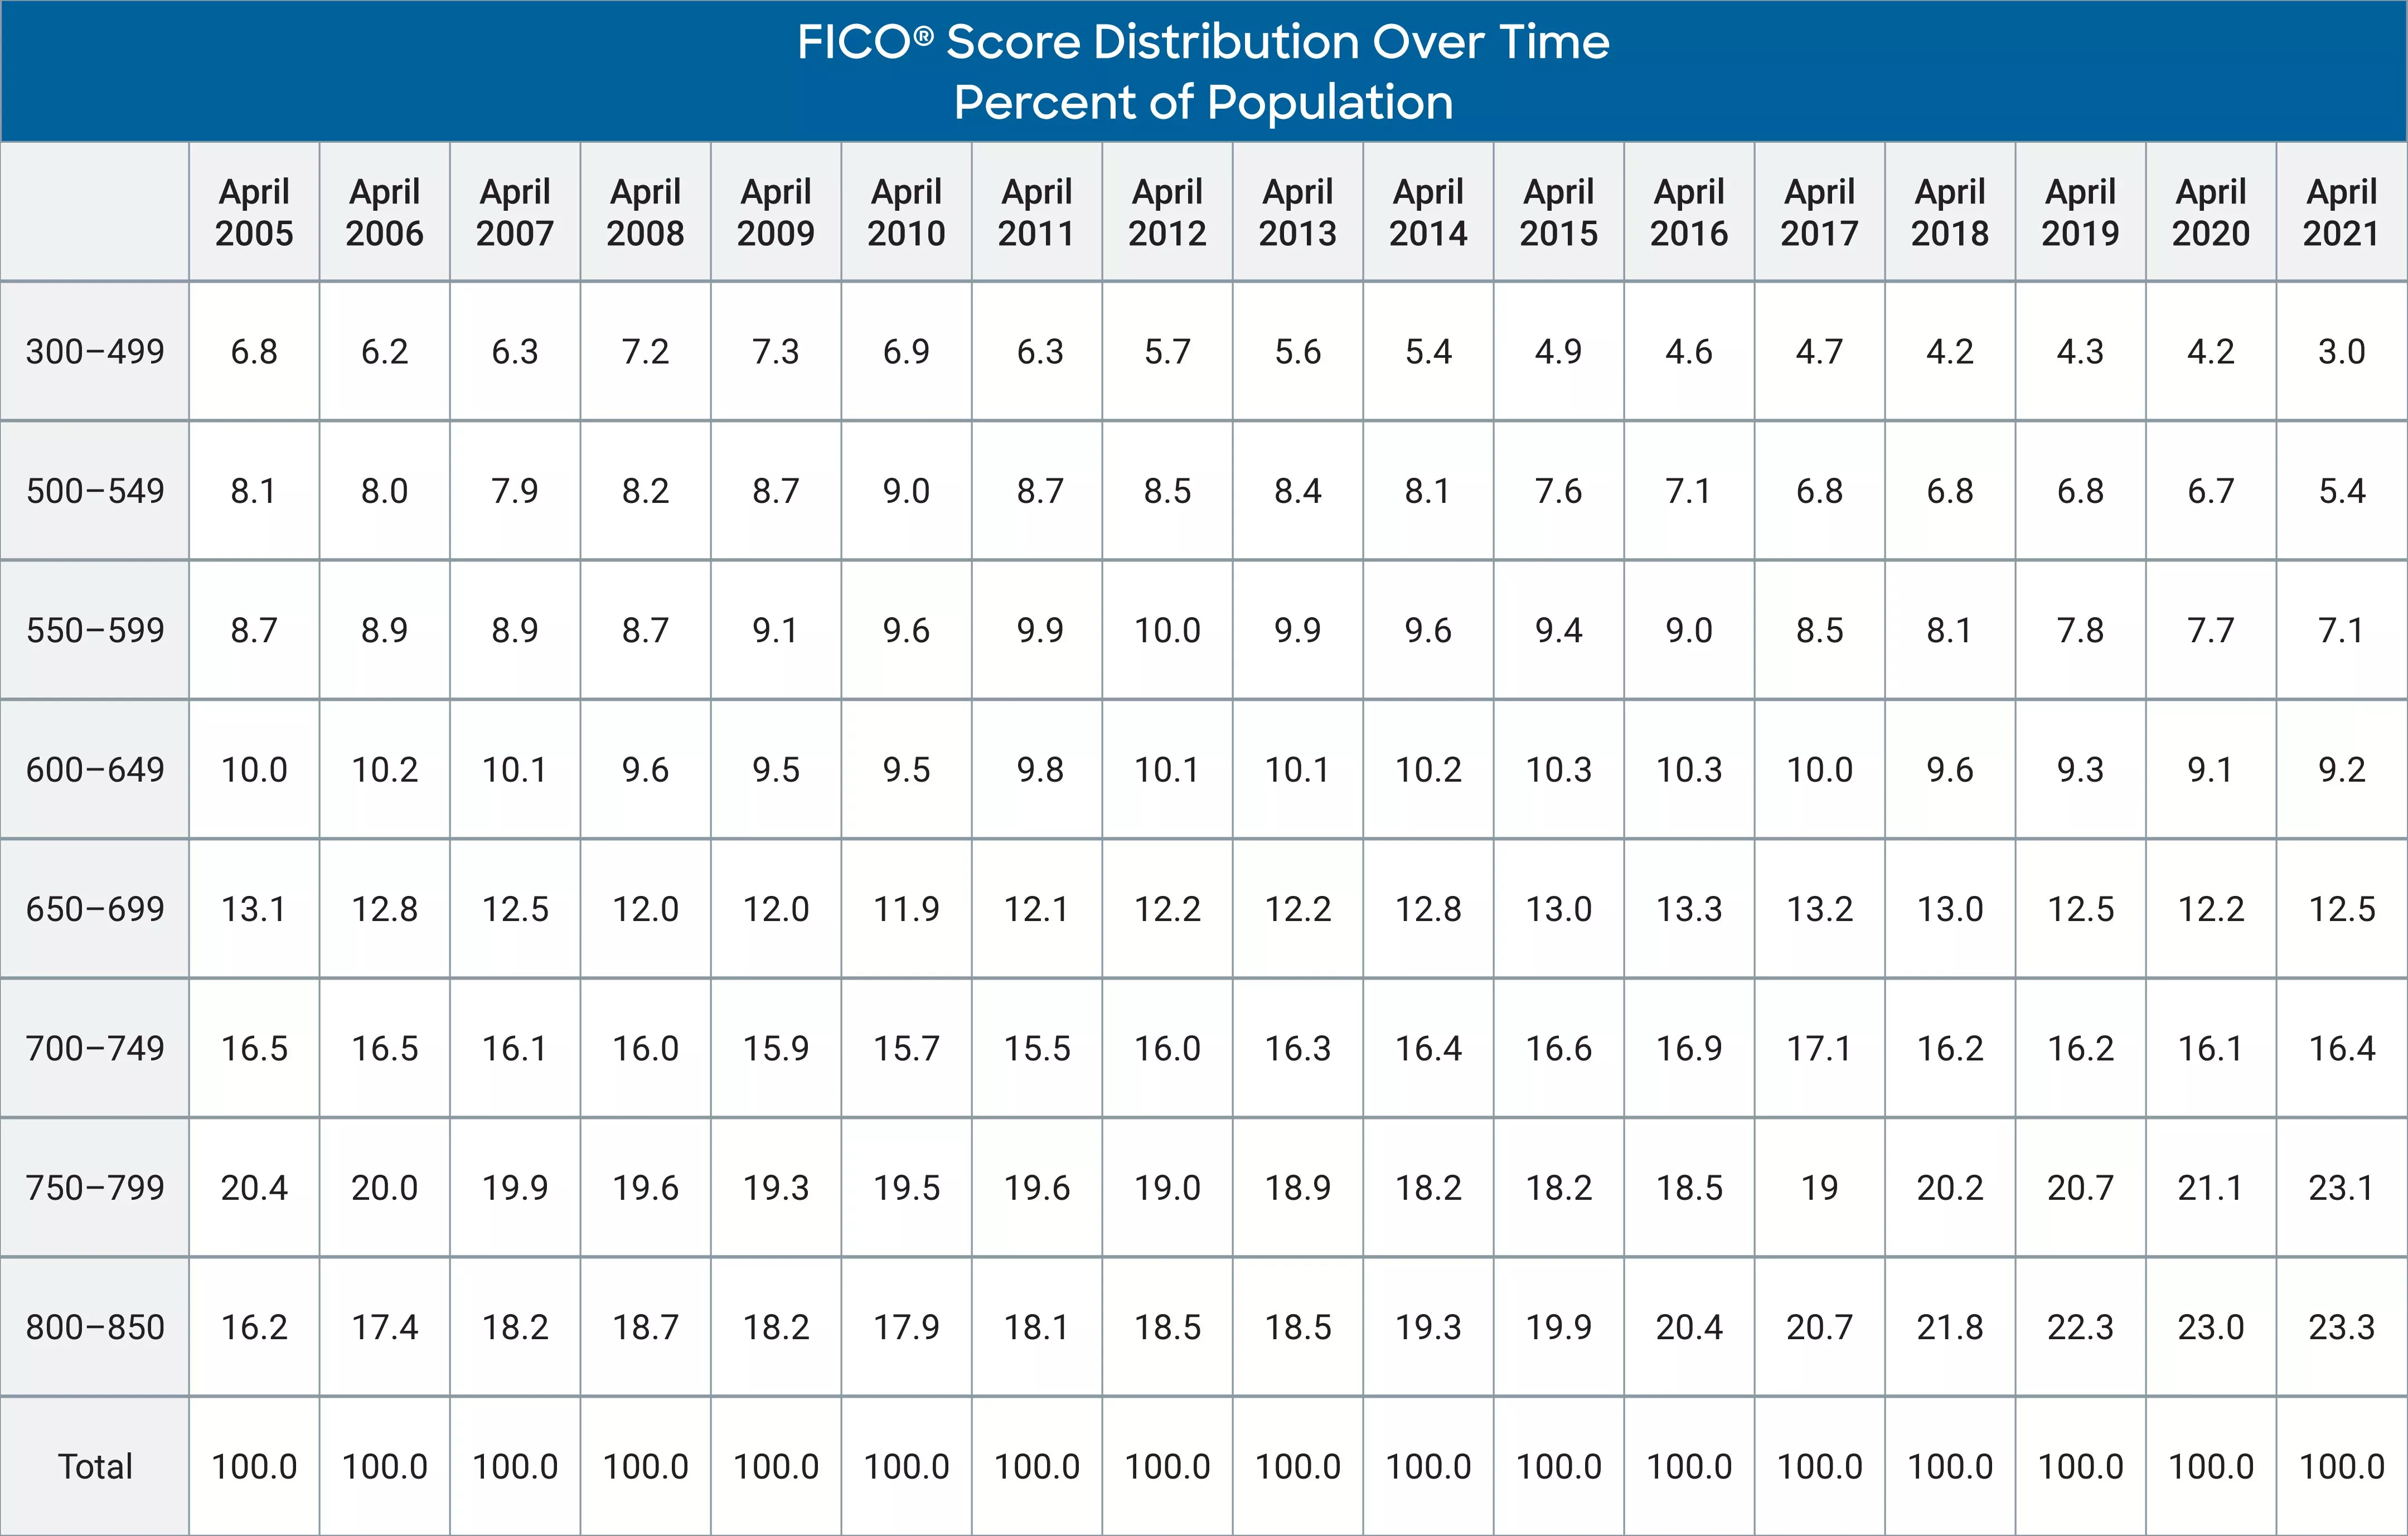
Figures 1. National Average FICO® Score Has Continued to Rise Through the Pandemic; FICO Score® Distribution Shows Similar Trend Towards Higher Scores
If you think the uptick in average FICO® Score is coming from the prime, lower risk/higher scoring segments, guess again!
The upwards trend in the average FICO Score is actually most pronounced in the lower score ranges. For example, for those consumers who had a FICO Score value between 550-599 as of January 2020 (pre-pandemic), their average score has gone up from 581 as of April 2020 to 601 as of April 2021. In contrast, those consumers who had a FICO Score value between 750-799 as of January 2020 have seen virtually no movement in their average score between April 2020 and today.
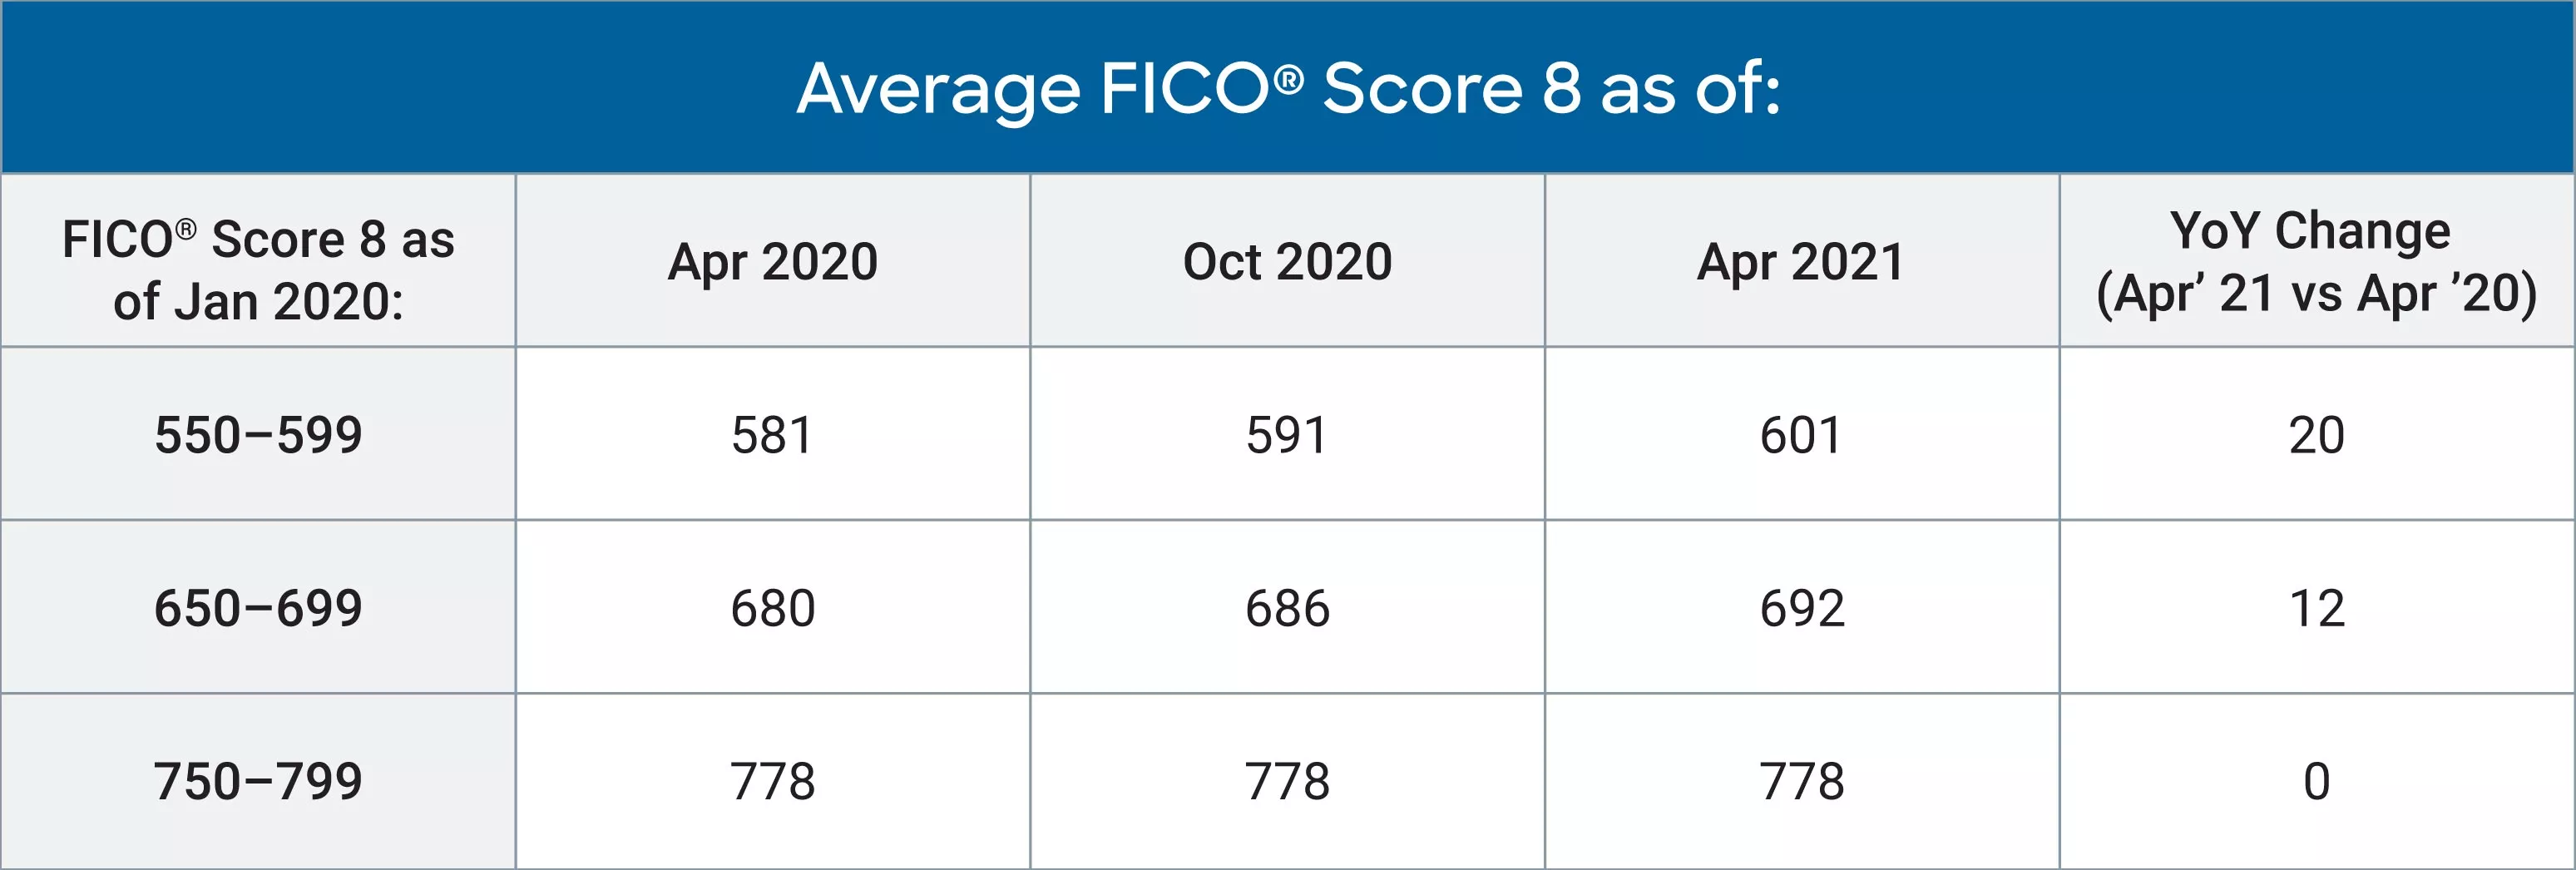
Figure 2. Average FICO® Score During COVID-19 Has Increased More for Lower Scoring Population
Though it might sound obvious, the drivers of the continued improvement in the average FICO® Score are continued improvements in key metrics considered by the score: fewer missed payments, lower consumer debt levels, and reduced credit seeking behavior. Let’s dive into each of these in a bit more depth:
- Missed payments reported in the credit file are down significantly. As of April 2021, just 15% of the population has had a 30+ day past due missed payment in the past year. This is down from 19.6% as of April 2020. As shown in figure 3, recent missed payments are down across key product types. While millions of U.S consumers have experienced disruption to their income since the onset of the pandemic, the combination of government stimulus programs such as the CARES Act and payment accommodation programs being offered by lenders continues to enable many consumers to avoid falling behind on their bills. Staying up-to-date on your bills can have a substantial and positive impact on your FICO® Scores. In fact, this ‘payment history’ dimension of the credit file represents some 35% of the overall FICO Score calculation.
- Consumer debt levels are decreasing. The uncertainty brought on by COVID-19, coupled with the fact that consumers simply had fewer opportunities to engage in discretionary spending during the lockdown phase of the pandemic, had a material impact on consumers’ willingness and ability to spend. Mix in the fact that many consumers – enabled, in part, by historic levels of savings at least partly driven by government stimulus such as enhanced unemployment benefits – have shifted their focus to paying down their credit card debt, and the result is a greater than 10% decrease in the average credit card balance and utilization of the U.S. consumer. “Amounts owed” comprises some 30% of the overall FICO® Score calculation and is heavily weighted towards credit card balances and utilization---so the observed reduction in credit card debt is helping to drive scores upwards.
- Fewer consumers are actively seeking credit. There has been a 12.1% year-over-year decrease in the average number of hard credit inquiries in consumers’ credit files. Hard credit inquiries represent instances where a credit file was requested by a lender in response to a consumer-initiated application for credit. This dip in credit seeking behavior likely goes hand-in-hand with the renewed consumer focus on reducing spending and paying down debt. The “new credit” dimension of the FICO® Score represents ~10% of the overall score calculation.
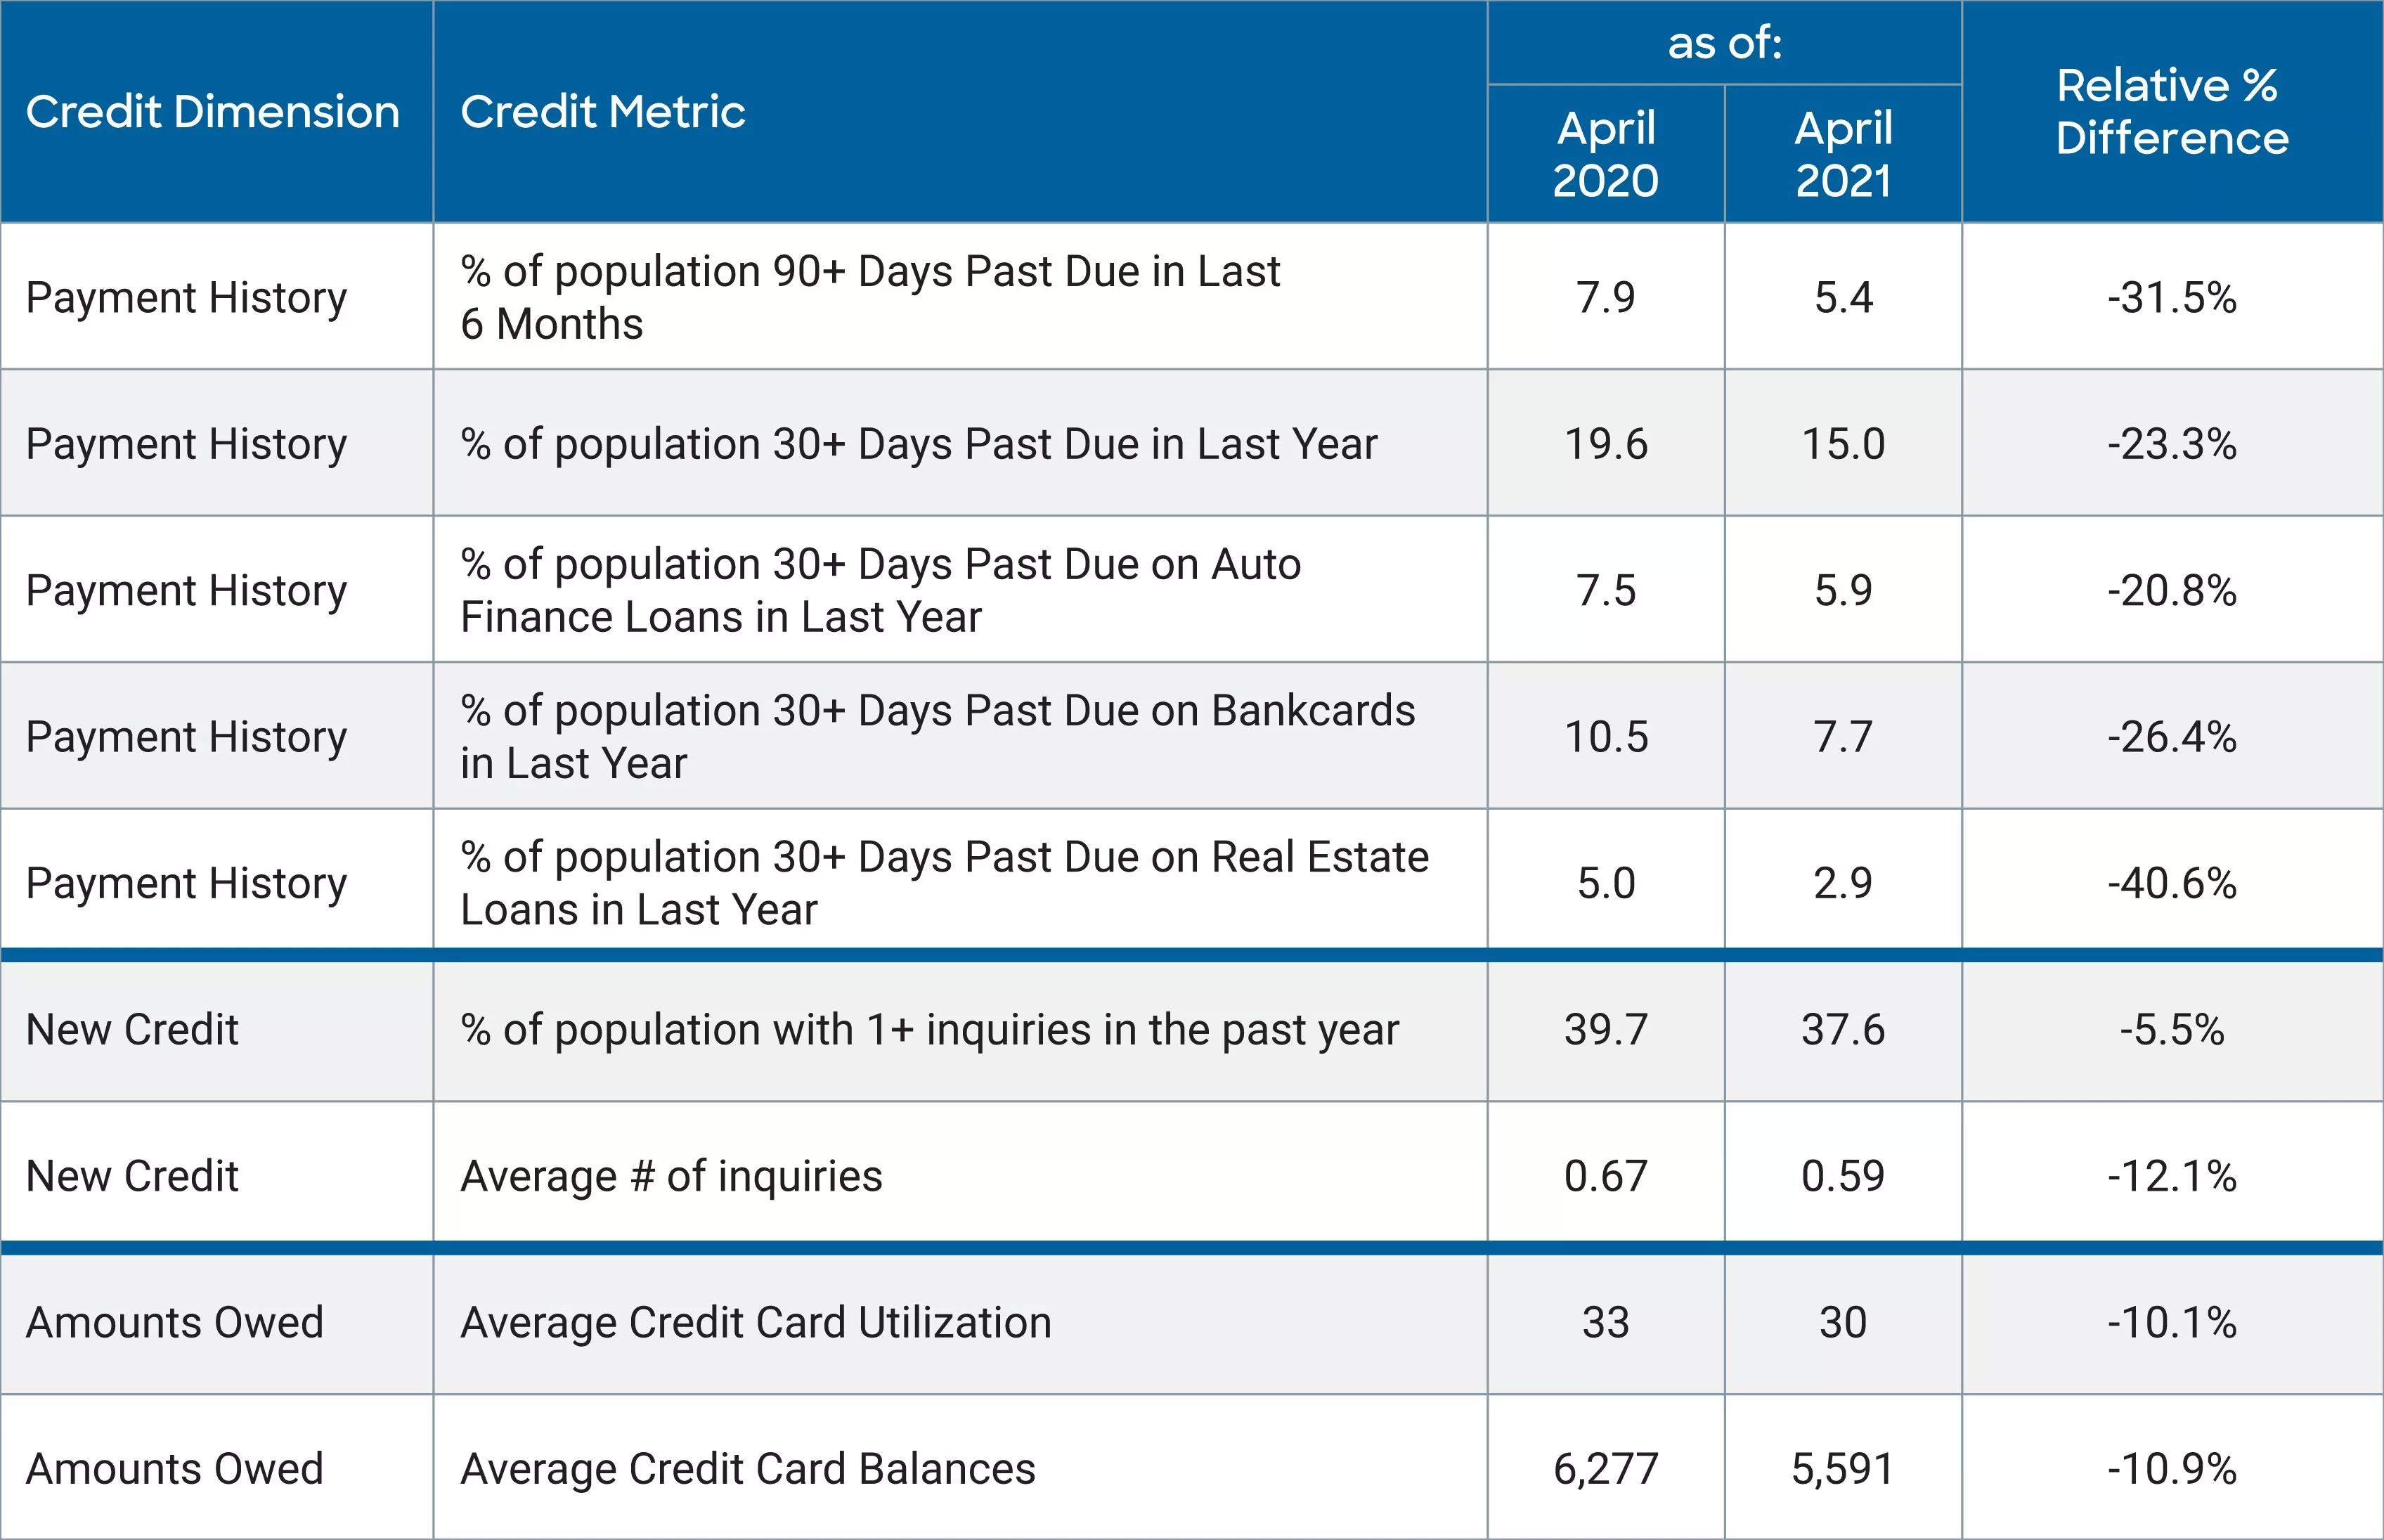
Figure 3. FICO Scorable Population Shows Significant Improvement in Key Credit Metrics During the Pandemic
Another factor supporting the uptick in average score through the pandemic is that the FICO® Score doesn’t negatively consider payment accommodation programs. Accounts reported as "current" with credit reporting codes related to forbearance or deferment, or that the consumer has been “affected by disaster,” will not cause the FICO Score to drop. This means that the millions of consumers who have requested/received some form of payment accommodation since the onset of the pandemic will have not experienced a hit to their FICO Score as a result of that accommodation being reported in their credit file.
Another potential factor in the upswing in the average FICO® Score is the increase in consumer awareness around credit reports and credit scores that has occurred during the pandemic. There was a significant amount written about potential credit score impacts in the early days of COVID-19; coupled with the three major U.S. CRAs offering free weekly credit reports to all U.S. consumers (something that was recently extended to April 2022), consumers interest in monitoring their credit reports and credit score, and better understanding the key drivers of the score, has increased. A major North American CRA conducted a study that concluded that COVID-19 has led to a measurable increase in consumer awareness about their financial wellness. And at FICO’s very own consumer portal for credit education and empowerment, myFICO.com, traffic to the home page has increased by 84% year-over-year since the onset of COVID-19. As studies have shown, consumers who increase their awareness of their FICO Score go on to miss fewer payments and improve their scores over time relative to a baseline population.
The Other Side of the Coin
While the continued improvement in U.S. consumer credit profiles in aggregate is encouraging, it is important to note that there are millions of consumers for whom the financial strain of the last year has been observable in their credit files. In fact, some 17% of the FICO scorable population experienced a score decrease of 20 or more points between April 2020 and April 2021 (figure 4). For many, this decrease has been driven by the inverse of the aggregate credit trends that are driving the national average FICO® Score upwards: the impacts of COVID-19-related income disruptions has led to missed payments and/or ramped up debt levels, as personal loans and credit cards are used as a lifeline to cover life necessities.
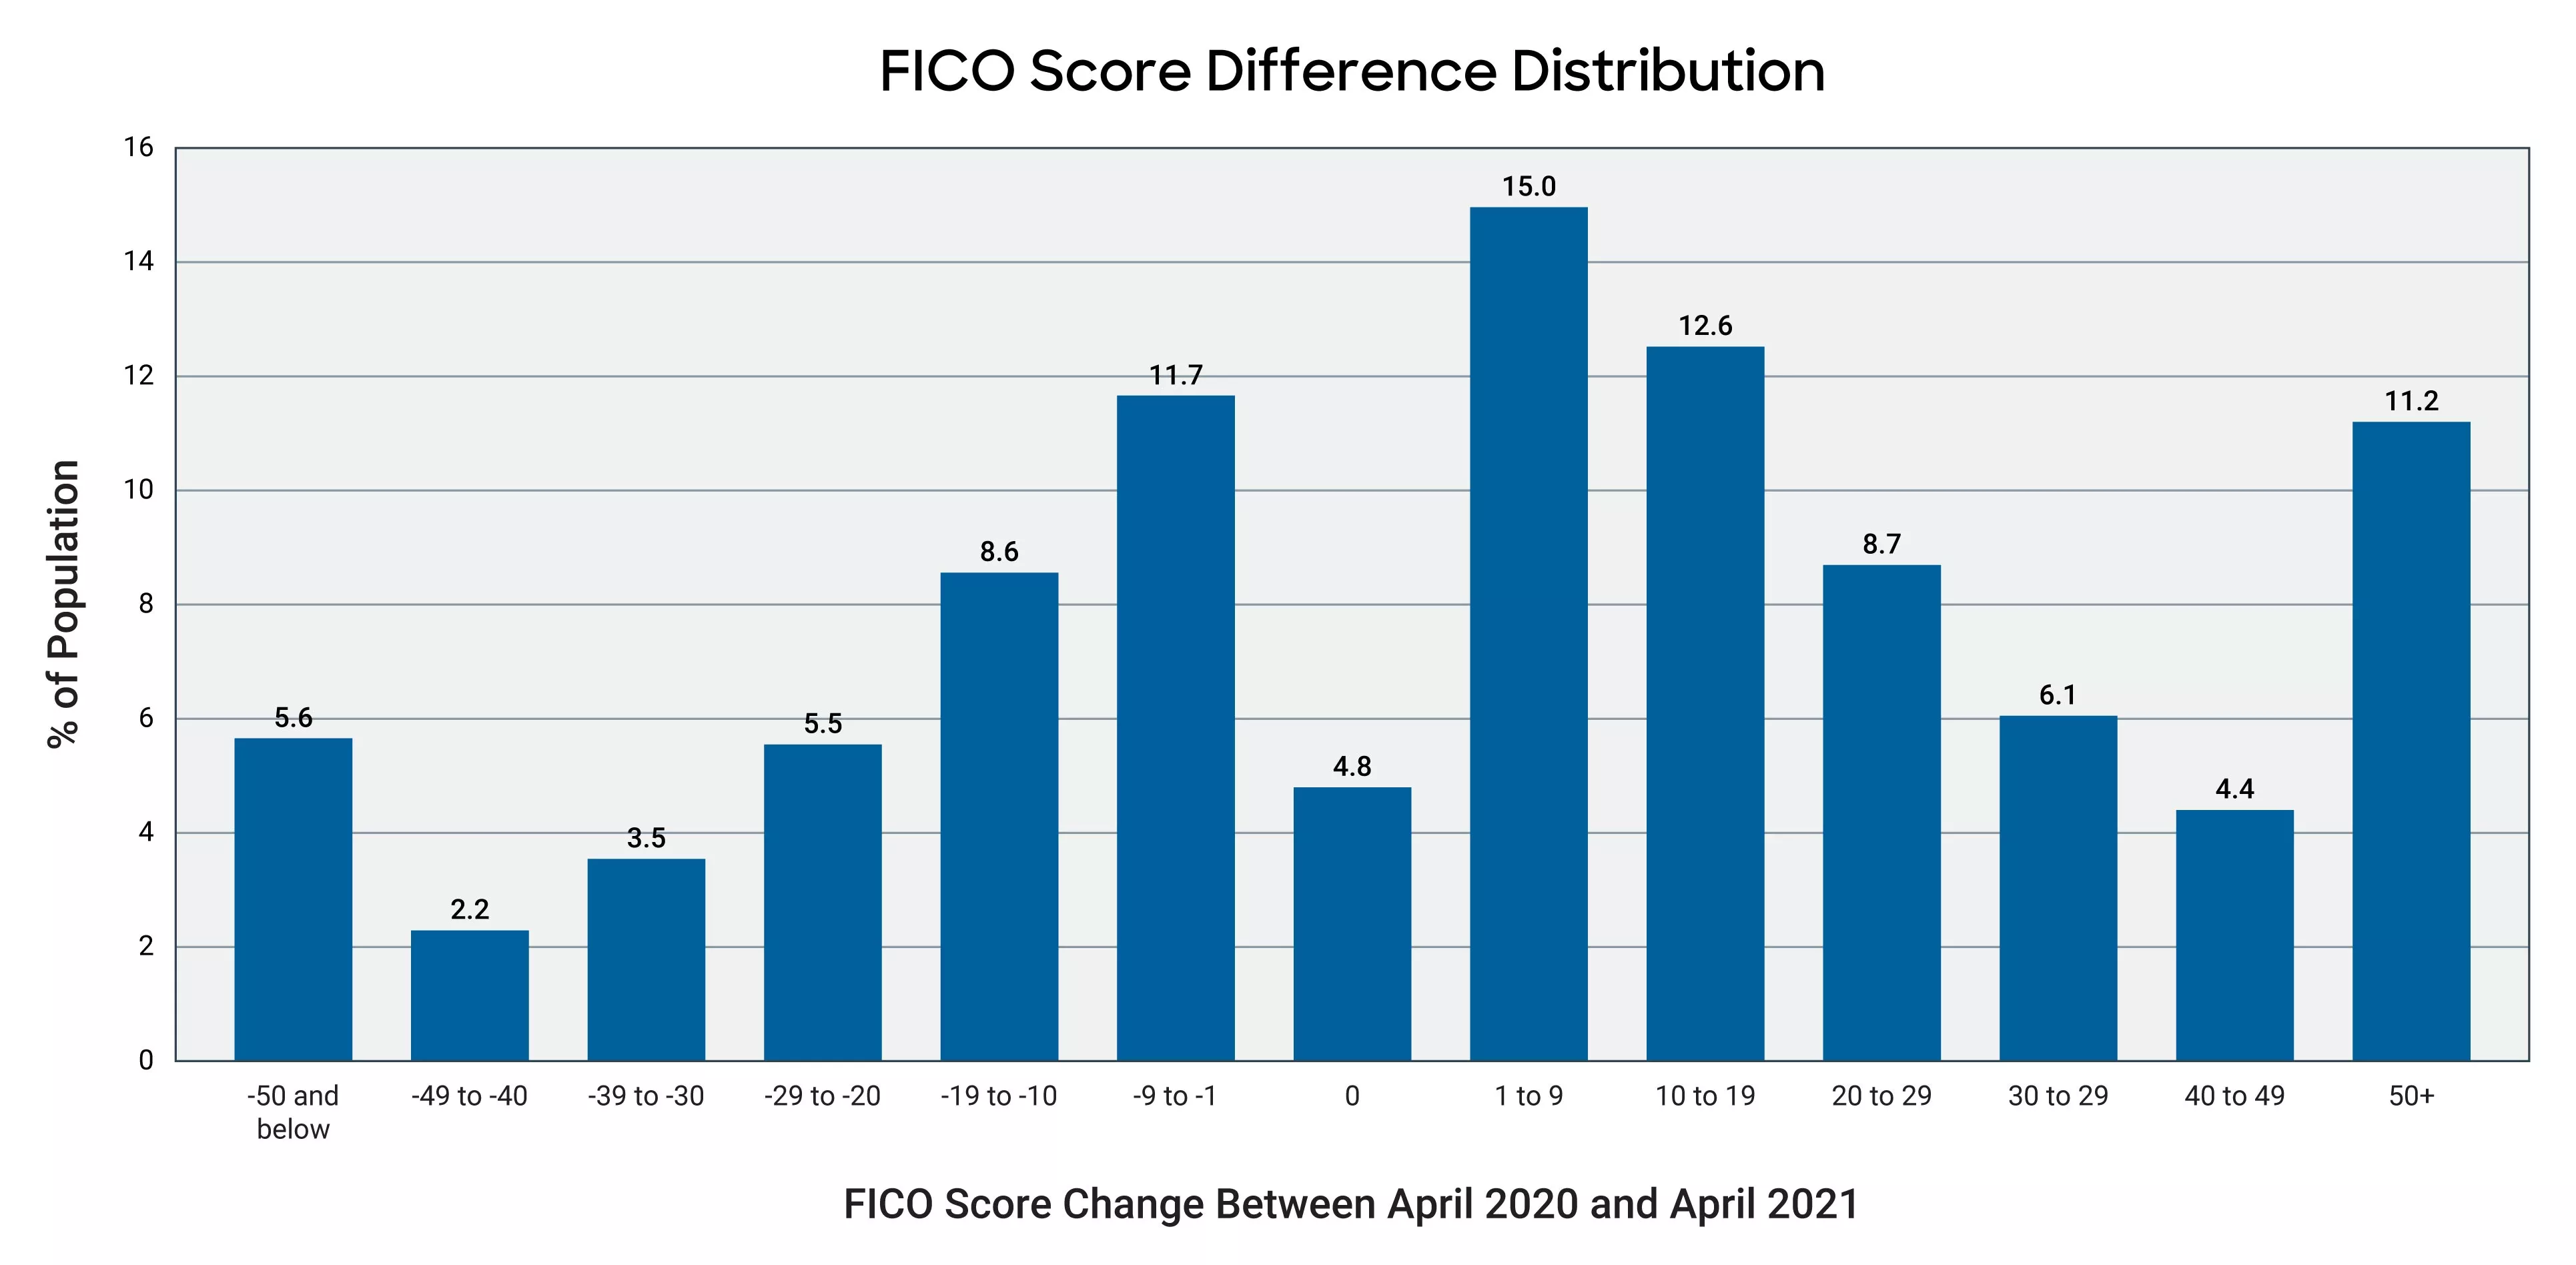
Figure 4. 37% of FICO Scorable Population Experienced Year-Over-Year Score Decrease
FICO continues to make efforts to empower all consumers through consumer education portals such as myFICO.com, and programs such as Score a Better Future, a financial education program designed to help consumers better understand their credit health and achieve their financial goals, and Open Access, which enables consumers to see the FICO® Scores used by their lenders. In addition, we continue to make significant efforts in expanding access to credit via alternative data-driven solutions such as FICO Score XD and the UltraFICO® Score to help lenders extend credit to millions of U.S. consumers who otherwise cannot be scored reliably, either due to insufficient or stale data in their traditional CRA credit files.
To learn more about FICO® Scores, check out these resources:
- How is FICO helping with financial inclusion?
- What is a FICO® Score?
- What Factors Contribute to a FICO® Score?
- FICO® Scores vs. Credit Scores
- Where to Access Your FICO® Score
* Industry-specific FICO score versions range from 250-900 (compared to 300-850 for base FICO Scores) and higher scores continue to equate to lower risk. For more details visit: https://www.myfico.com/credit-education/credit-scores/fico-score-versions

Popular Posts

The GSE Data Is Public. Here's What It Shows About Credit Score Modernization.
Independent Milliman analysis of GSE historical data confirms what anyone can now verify directly: FICO® Score 10T is the most predictive score.
Read more
FICO Statement on FHFA and FHA Updates to Credit Score Modernization
FICO supports FHFA’s announcement that the long-anticipated historical data for FICO® Score 10T will be released to the mortgage market.
Read more
FICO® Score High Achievers: Is Age the Only Factor?
<p>FICO’s latest research on <a href="http://www.fico.com/en/blogs/risk-compliance/us-credit-quality-rising-the-beat-goes-on/" target="_blank">national FICO® Score distribution</a> shows that US credit quality continues to trend upwards, with an increasing number of consumers scoring in the highest scores ranges. Given that, we decided it was time to refresh our study on “<a href="http://www.fico.com/en/blogs/risk-compliance/infographic-what-does-a-high-credit-scorer-look-like/" target="_blank">FICO® Score high achievers</a>,” where we examine the credit behavioural profiles of consumers with higher credit scores.</p> <p>As expected, our latest study showed that older people generally have higher scores, as has been the case in our <a href="http://www.fico.com/en/blogs/risk-compliance/age-before-beauty-credit-worthiness-before-youth/" target="_blank">past research</a>. This is largely because they have trade lines that have been open longer, which leads to higher scores (assuming the trade lines are in good standing and all other things equal). The most credit savvy among you will remember that length of credit history accounts for roughly 15% of the overall <a href="http://www.myfico.com/CreditEducation/WhatsInYourScore.aspx" target="_blank">FICO® Score calculation</a>.</p> <p>But for younger consumers, it isn’t too helpful to say, “just wait until you are 50 years old, and that will fix things!” Thus, I decided to dive deeper with our analysis, including looking at the credit behavioural characteristics of younger consumers with high FICO® Scores.</p> <p>In this analysis, I looked at credit characteristics for the two highest score bands, 750-799 and 800-850, which have about 16% and 23% of the population, respectively. I further broke this down by looking at the characteristics of the youngest 15% in each group, which occurs at age 29 for the 750-799 group and 43 for the 800-850. We used FICO<strong>®</strong> Score 9 for our analysis, and examined typical variables of the categories that go into the make-up of the score.</p> <p><a href="http://www.fico.com/en/blogs/wp-content/uploads/2016/10/FICO-Score-High-Achiever-table.png"><img class="alignnone size-full wp-image-29367" src="http://www.fico.com/en/blogs/wp-content/uploads/2016/10/FICO-Score-High-Achiever-table.png" alt="fico-score-high-achiever-table" width="715" height="747" /></a></p> <p>Since there’s a lot to dissect in this chart, I’ll highlight a few findings that struck me: <ul> <li><strong>Credit history.</strong> Higher scores are undoubtedly associated with a longer time on file. What’s striking is the higher average time on file for the 800+ group, both overall and for revolving accounts (the most common trade line). Clearly, it helps to start credit use early in life – but that’s not the sole determining factor for high scoring. The younger cohorts in both the 800+ and 750-799 groups have time on file medians significantly less than their older counterparts.</li> <li><strong>New credit.</strong> High credit scorers do, in fact, pursue new credit. We see little variation in months since last trade line opening and last inquiry among all groups observed.</li> <li><strong>Pay on time.</strong> As you might expect, the further in the past the delinquency, the higher the score – and that’s <u>if</u> a delinquency ever happened. 95% of the 800+ people and 72% of the 750-799 group have never been delinquent, which is a striking contrast to the 57% for the total population. The percentages for the younger groups are even higher, especially so for the 750-799ers. Collection items are also scarce for these high scorers. While 23% of the national population have collection items greater than $99, the figures are only 0.5% for the 800+ group and 3% for the 750-799 group. It is clear that, in conjunction with starting a credit file early, paying on time is a key trait of the FICO® Score high achiever.</li> <li><strong>Balance and utilization.</strong> Finally, we look at how credit is being used, focusing on revolving product use. (Since most people only have one mortgage or one auto loan, variation in instalment product figures is minimal and driven by payment history, which is near perfect for high scorers, as we’ve seen.) FICO® Score high achievers tend to have more open revolving accounts. While the % active trades and utilization are generally lower, by no means do high scorers avoid the use of credit products. What drives the difference here is the amount of <u>available</u> revolving credit utilized. The 800+ group is roughly 1/4 of the national median, both in total and on their highest utilized card; they also have lower balances and more cards<em>. </em>The 750-799 group is more active and higher utilized, but still only at 2/3 of the national figures. The young 750-799 group compensate with lower revolving balances and, as a result, lower utilization, which is in line with what we see for the 800+ group.</li> <li><strong>Benchmarks.</strong> I’d like to point out that while this study provides good benchmarks of the typical credit traits of the FICO® Score high achiever, individual credit profiles will vary widely. And keep in mind that when we sort groups of consumers as a whole by different behaviours, some results may look superficially odd. For example, the 800+ band has a longer median average open account time (128 months) than average revolving months on file (140 months).</li> </ul> So, what do we conclude? A huge takeaway is that high scorers don’t have too much in the way of serious delinquencies and negative public record data.</p> <p>In most respects, the young 800+ people are like their peer group. They really only differ markedly in their shorter credit history and higher non-mortgage balance, both of which are a function of life stage. Our results show that you don’t have to be a credit product hermit; these high scorers have more credit cards. The takeaway is to start credit activity early and maintain well-managed and moderate usage.</p> <p>In many ways, the young 750-799 people are more interesting because their age profile is much younger. Their credit characteristics differ more from their peer group, particularly in terms of length of credit history. They compensate by having almost pristine credit records and lower balances.</p> <p>Ultimately, 39% of US consumers are FICO® Score high achievers, which they accomplish by following common-sense credit practices. It ain’t rocket science!</p>
Read moreTake the next step
Connect with FICO for answers to all your product and solution questions. Interested in becoming a business partner? Contact us to learn more. We look forward to hearing from you.