Combining Machine Learning with Credit Risk Scorecards
Here's how to get the full power of machine learning without losing the transparency that’s important from credit risk scorecards

With all the benefits of artificial intelligence, many of our customers are wanting to leverage machine learning to improve other types of analytic models already in use, such as credit risk assessment. With 30 years of experience with AI and machine learning under our belt, we can certainly help.
I have blogged about how we use AI to build credit risk models. In this post, I’d like to drill into one of the examples, to discuss an approach that provides a way to harness the full power of machine learning in the credit risk arena for those who are still on the fence and continuing to use scorecard models. It is also noteworthy that in the intervening years, FICO has made tremendous progress in making AI models explainable, constrained and engineerable and able to withstand regulatory scrutiny, thus making AI models suitable for credit risk models. These have been discussed in other blog articles. .
How Do You Build a Model with Limited Data?
A traditional credit risk scorecard model generates a score reflecting probability of default, using various customer characteristics as inputs to the model. These characteristics could be any customer information that is deemed relevant for assessing the probability of default, provided the information is also allowed by regulations. The input is binned into different value ranges and each of these bins is assigned a score weight. While scoring an individual, the score weights corresponding to the individual’s information are added up to produce the score.
While building a scorecard model, we need to “bin” the characteristics into value ranges, and the bins are meant to maximize the separation between known good cases and known bad cases. This separation is measured using weight of evidence (WoE), a logarithmic ratio of fraction of good cases and fraction of bad cases present in the bin. A WoE of 0 means that the bin has same distribution of good and bad cases as the overall population. The further away this value is from 0, the more concentration the bin has of one type of case versus the other, as compared to the overall population. A scorecard will generally have a few bins, with a smooth distribution of WoE.
As I described in my post, our project was to build credit risk models for a home equity portfolio. Home equity lending slowed dramatically after the recession, and due to this we had few bad exemplars in the development sample, and only a 0.2% default rate. It was difficult to build models using traditional scorecard techniques.
The primary reason for this is the inability of a scorecard model to interpolate information. Information needs to be explicitly provided to the scorecard model and the standard way to do this is by providing sufficient good and bad counts for each bin to compute reliable WoE. If good or bad counts are not sufficient, as in this case, this approach ends up yielding noisy, choppy WoE distribution across bins, leading to weak-performing scorecard models.
Next, we used a machine learning algorithm called Tree Ensemble Modeling or TEM. TEM involves building multiple “tree” models, where each node of the tree is a variable which is split into two further sub-trees.
Each tree model that we build in TEM is built on a subset of the training dataset, and uses just a handful of characteristics as input. This limits the degrees of freedom of the tree model, yields a shallow tree as a consequence and ensures that the splitting of the variables is limited. This allows us to meet the requirement on the minimum number of good and bad cases more diligently.
The following schematic shows an artistic rendition of a TEM, depicting multiple shallow trees in a group or an Ensemble. The final score output, produced through Ensemble Modeling, is usually an average of the scores of all the constituent tree models in the Ensemble.
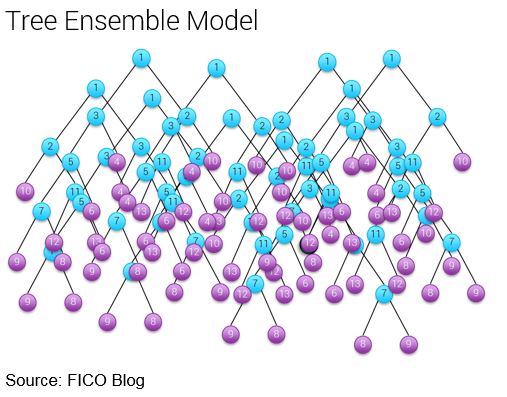
Such a model can have thousands of trees and tens of thousands of parameters that have no simple interpretation. Unlike a scorecard, you can’t tell a borrower, a regulator or even a risk analyst why someone scored the way they did. This inability to explain the reason why someone got a particular score is a big limitation of an approach like TEM.
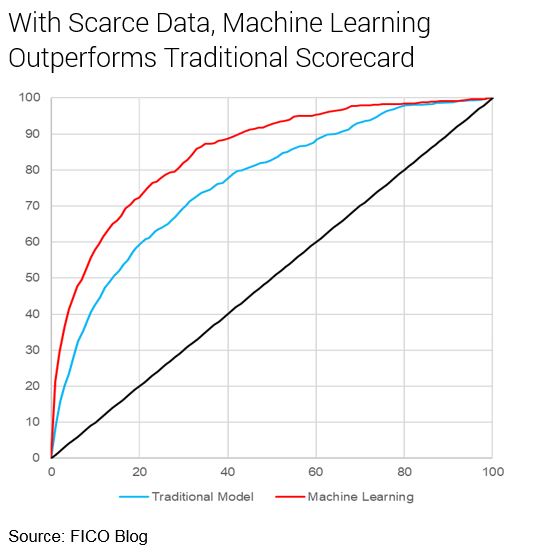
However, by building a machine learning model, we were able to confirm that our scorecard approach was losing a significant amount of predictive power. Although not practical for use, the machine learning score outperformed the scorecard. Our next challenge was to try and narrow the performance gap between the TEM and the scorecard models.
Scorecards Mimicking Machine Learning
FICO has faced this challenge many times before: where there is a demand for a scorecard model even though a machine learning model provides a much more powerful decisioning capability: How do you retain the deep insights of machine learning and AI, which can uncover patterns scorecard development approaches can’t and impart that knowledge to a scorecard model?
Over the years we have developed practical ways to address the previously identified limitations of machine learning models that hitherto didn’t allow them to be applied in regulated decision scenarios, such as lending and credit risk decisioning. For instance, we have developed mechanisms for imputing domain knowledge and explainability into neural networks and other machine learning models. We have also developed methodologies to apply constraints on the relationships between input and output of machine learning models, as well as engineer those relationships much like in case of scorecards.
Still there are situations where some businesses are hesitant in using machine learning models directly. In such cases, we recommend leveraging a methodology called Teacher-Student learning. In this approach a machine learning model is first trained which is capable of learning complex non-linear relationships in the data. Such a model is called a “Teacher” model. The TEM machine learning model that we discussed earlier can act as the Teacher model.
We then train a “Student” model which is a set of segmented scorecards, which recodes the patterns and insights discovered using the Teacher machine learning model. We aim to match the score distribution generated by the Teacher model, instead of relying on the WoE approach that we discussed earlier. So instead of providing good and bad data points and directly computing the WoE, the score distribution in each bin derived from the machine learning Teacher model ends up providing an estimate of WoE.
Significantly, the final model is almost as predictive as the Teacher machine learning model. An out-of-time validation of the final model demonstrates that it performs well over a period of time, as shown in the following figure.
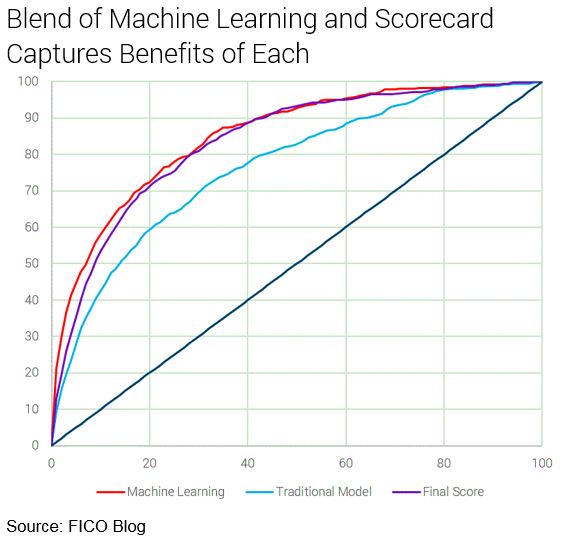
The final result of this approach is a strong, palatable segmented scorecard model. Our hybrid approach overcame the limitations imposed by the fewer number of bad cases. Whereas previously it was considered impossible to build powerful scorecards for problem spaces with such sparse bad cases, the Teacher-Student approach allows us to do so, whenever a machine learning algorithm can be built to extract more signal from such datasets.
It is worth noting that another machine learning technique, such as a neural network model, would work as effectively as TEM. Thus, the approach described above is not limited by the choice of machine learning architecture, if the machine learning architecture is designed to extract more signal from the training data than the scorecard model.
This is just one approach that FICO data science teams use to leverage the power of AI in heavily regulated areas where reasons related to score loss are needed. It represents our commitment to expanding AI to new areas for our customers, something we have been practicing for more than 30 years.
How FICO Can Help You Build Better Risk Models
- Explore our modelling services
- Read more about Responsible AI
- Download our Playbook for Responsible AI
This is an update of a post from 2017.

Popular Posts

Average U.S. FICO® Score at 716, Indicating Improvement in Consumer Credit Behaviors Despite Pandemic
The FICO Score is a broad-based, independent standard measure of credit risk
Read more
The GSE Data Is Public. Here's What It Shows About Credit Score Modernization.
Independent Milliman analysis of GSE historical data confirms what anyone can now verify directly: FICO® Score 10T is the most predictive score.
Read more
FICO® Score High Achievers: Is Age the Only Factor?
<p>FICO’s latest research on <a href="http://www.fico.com/en/blogs/risk-compliance/us-credit-quality-rising-the-beat-goes-on/" target="_blank">national FICO® Score distribution</a> shows that US credit quality continues to trend upwards, with an increasing number of consumers scoring in the highest scores ranges. Given that, we decided it was time to refresh our study on “<a href="http://www.fico.com/en/blogs/risk-compliance/infographic-what-does-a-high-credit-scorer-look-like/" target="_blank">FICO® Score high achievers</a>,” where we examine the credit behavioural profiles of consumers with higher credit scores.</p> <p>As expected, our latest study showed that older people generally have higher scores, as has been the case in our <a href="http://www.fico.com/en/blogs/risk-compliance/age-before-beauty-credit-worthiness-before-youth/" target="_blank">past research</a>. This is largely because they have trade lines that have been open longer, which leads to higher scores (assuming the trade lines are in good standing and all other things equal). The most credit savvy among you will remember that length of credit history accounts for roughly 15% of the overall <a href="http://www.myfico.com/CreditEducation/WhatsInYourScore.aspx" target="_blank">FICO® Score calculation</a>.</p> <p>But for younger consumers, it isn’t too helpful to say, “just wait until you are 50 years old, and that will fix things!” Thus, I decided to dive deeper with our analysis, including looking at the credit behavioural characteristics of younger consumers with high FICO® Scores.</p> <p>In this analysis, I looked at credit characteristics for the two highest score bands, 750-799 and 800-850, which have about 16% and 23% of the population, respectively. I further broke this down by looking at the characteristics of the youngest 15% in each group, which occurs at age 29 for the 750-799 group and 43 for the 800-850. We used FICO<strong>®</strong> Score 9 for our analysis, and examined typical variables of the categories that go into the make-up of the score.</p> <p><a href="http://www.fico.com/en/blogs/wp-content/uploads/2016/10/FICO-Score-High-Achiever-table.png"><img class="alignnone size-full wp-image-29367" src="http://www.fico.com/en/blogs/wp-content/uploads/2016/10/FICO-Score-High-Achiever-table.png" alt="fico-score-high-achiever-table" width="715" height="747" /></a></p> <p>Since there’s a lot to dissect in this chart, I’ll highlight a few findings that struck me: <ul> <li><strong>Credit history.</strong> Higher scores are undoubtedly associated with a longer time on file. What’s striking is the higher average time on file for the 800+ group, both overall and for revolving accounts (the most common trade line). Clearly, it helps to start credit use early in life – but that’s not the sole determining factor for high scoring. The younger cohorts in both the 800+ and 750-799 groups have time on file medians significantly less than their older counterparts.</li> <li><strong>New credit.</strong> High credit scorers do, in fact, pursue new credit. We see little variation in months since last trade line opening and last inquiry among all groups observed.</li> <li><strong>Pay on time.</strong> As you might expect, the further in the past the delinquency, the higher the score – and that’s <u>if</u> a delinquency ever happened. 95% of the 800+ people and 72% of the 750-799 group have never been delinquent, which is a striking contrast to the 57% for the total population. The percentages for the younger groups are even higher, especially so for the 750-799ers. Collection items are also scarce for these high scorers. While 23% of the national population have collection items greater than $99, the figures are only 0.5% for the 800+ group and 3% for the 750-799 group. It is clear that, in conjunction with starting a credit file early, paying on time is a key trait of the FICO® Score high achiever.</li> <li><strong>Balance and utilization.</strong> Finally, we look at how credit is being used, focusing on revolving product use. (Since most people only have one mortgage or one auto loan, variation in instalment product figures is minimal and driven by payment history, which is near perfect for high scorers, as we’ve seen.) FICO® Score high achievers tend to have more open revolving accounts. While the % active trades and utilization are generally lower, by no means do high scorers avoid the use of credit products. What drives the difference here is the amount of <u>available</u> revolving credit utilized. The 800+ group is roughly 1/4 of the national median, both in total and on their highest utilized card; they also have lower balances and more cards<em>. </em>The 750-799 group is more active and higher utilized, but still only at 2/3 of the national figures. The young 750-799 group compensate with lower revolving balances and, as a result, lower utilization, which is in line with what we see for the 800+ group.</li> <li><strong>Benchmarks.</strong> I’d like to point out that while this study provides good benchmarks of the typical credit traits of the FICO® Score high achiever, individual credit profiles will vary widely. And keep in mind that when we sort groups of consumers as a whole by different behaviours, some results may look superficially odd. For example, the 800+ band has a longer median average open account time (128 months) than average revolving months on file (140 months).</li> </ul> So, what do we conclude? A huge takeaway is that high scorers don’t have too much in the way of serious delinquencies and negative public record data.</p> <p>In most respects, the young 800+ people are like their peer group. They really only differ markedly in their shorter credit history and higher non-mortgage balance, both of which are a function of life stage. Our results show that you don’t have to be a credit product hermit; these high scorers have more credit cards. The takeaway is to start credit activity early and maintain well-managed and moderate usage.</p> <p>In many ways, the young 750-799 people are more interesting because their age profile is much younger. Their credit characteristics differ more from their peer group, particularly in terms of length of credit history. They compensate by having almost pristine credit records and lower balances.</p> <p>Ultimately, 39% of US consumers are FICO® Score high achievers, which they accomplish by following common-sense credit practices. It ain’t rocket science!</p>
Read moreTake the next step
Connect with FICO for answers to all your product and solution questions. Interested in becoming a business partner? Contact us to learn more. We look forward to hearing from you.