Debt Collection: 5 Questions for Meeting Inbound Demand
The pandemic has put stress on lenders' and debt collectors' ability to meet inbound demand - here are 5 points for reviewing your abilities


In my last post, “Debt Collection in the Pandemic: Why UK Customers are Dissatisfied”, based on insights obtained from a FICO and Censuswide customer survey, I looked at the importance of KYC (“Know Your Customer”) in collections and some of the practical steps that you can take to eradicate customer dissatisfaction by ensuring the delivery of effective communication. These steps included:
- Getting the right data
- Using more analytics and
- Executing customer level collections
Now let’s dig a bit deeper into the results of the FICO and Censuswide survey and look at how you can ensure that you are well set for effectively managing inbound customer demand
At the start of the pandemic, the initial surge of customer demand, for the majority of financial institutions, was created by the introduction of payment holiday schemes. This demand put significant stress on collections operations, with many unable to cope with the volumes of calls received. The inability to deal promptly with customers’ concerns led to the high levels of dissatisfaction and frustration detailed in my last blog. However, the demand witnessed is not surprising, as our survey showed that the telephone is still the most popular method of communication for customers when trying to contact their financial providers.
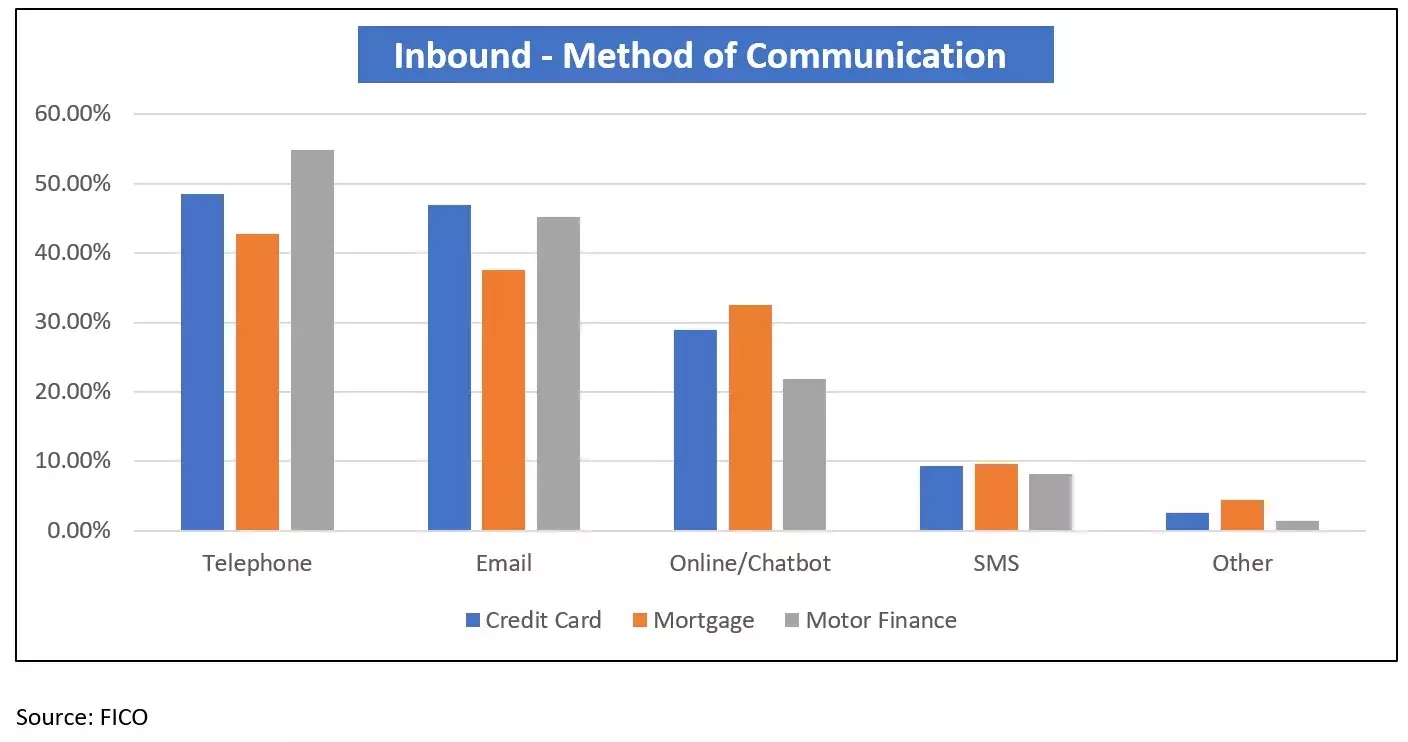
Email was a close second when trying to gain contact, with online/chatbot and SMS coming 3rd and 4th.
These findings are very interesting when you consider that we are supposedly in the era of digital transformation, with frictionless customer journeys the name of the game. Why would customers default to the telephone as the primary channel with the availability of email, online websites, chatbots and SMS? My thoughts are that:
At a time of crisis and panic people default to the route that they perceive to be the one that will give them an instant, reassuring answer, in spite of the fact that they probably know there will be challenges getting through – see Figure 2 below.
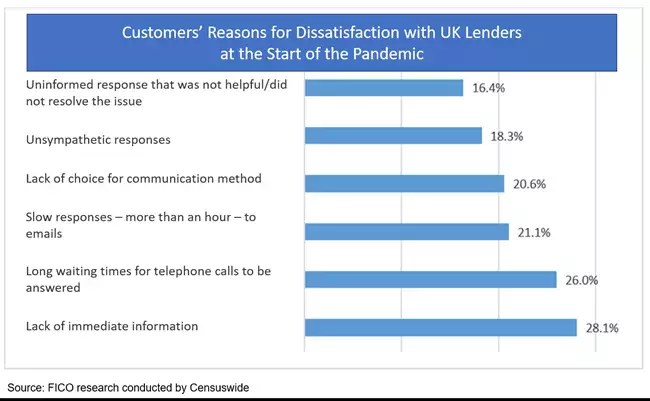
- While many customers attempted contact via email, our survey found that 21%% of customers were dissatisfied with the time it took to get a response. This demonstrates that, in the absence of a genuine, automated 2-way email process driven by sophisticated artificial intelligence and machine learning, email is constrained and does not speed up the process of resolution or alleviate friction.
- For online/chatbot, customers do not have faith that their queries would be answered quickly enough, via the online channel, even in the event of a “live chat” being available, particularly if there is high customer demand. This may be compounded by a lack of genuine self-service capability and the fact that while chatbots are useful for solving relatively simple problems, they are not that effective at solving complex or emotional queries.
- SMS is a constrained channel when it comes to the customer instigating contact. Customers may feel that SMS did not allow them to express their situation or the extent of their concerns sufficiently, nor get an appropriate response within a reasonable period of time.
I am sure that many businesses will have spent time reflecting and reviewing their business contingency/disaster recovery plans with a view to identifying what they could have done differently, and what should be put in place to handle a similar situation in the future. Here are some practical things that you can do to get on the front foot.
Checklist for Meeting Inbound Customer Demand
1. Why are customers contacting you?
Even in a time of crisis, when things are seemingly out of your control, it should be possible to identify the reasons people are trying to speak with you. Understanding this is key to operational excellence and delivering superior customer journeys. This is actually one of the key questions we ask our clients when helping them to automate their Inbound processes but, unfortunately, the answer is not always readily available.
2. What does the “Why” tell you?
Once you have this insight it will enable you to identify what customer calls can realistically be automated and which calls will still require manual intervention. The automated customer journeys can then be designed taking into consideration channel availability, channel suitability and channel preference.
3. How agile is your current Inbound IVR?
One of the main constraints during the initial stages of the pandemic was the ability for businesses to quickly change the content and configuration of their Inbound IVRs. We know that Inbound IVRs provide great self-service opportunities, but they can also be used to educate customers quickly, and effectively on alternative channel availability, at times of significant demand. By signposting customers to these alternative channels demand load can be spread across multiple channels thereby reducing operational stress.
In addition, introducing tactics such as interactive SMS and email to provide automated acknowledgement responses, in the event the customer has been unsuccessful in gaining resolution via the IVR, can meet customers’ expectations, mitigating any concerns or fears they may have. As a result, having the ability to change your IVR should now be considered “critical path” in relation to effectively managing customer demand, particularly from a business contingency or disaster recovery perspective. If an upgrade of your telephony infrastructure isn’t possible right now, one alternative is the introduction of a low-cost omnichannel platform with an inbuilt Inbound channel. This would enable you to run a “parallel” Inbound capability providing you with the agility to make quick changes, as and when required.
4. How can you improve the channels that you currently offer your customer that allow them to initiate contact?
As we saw in the survey results, the “digital” channels of online, chatbot and SMS were not favored by customers when initiating contact. This is disappointing and demonstrates that most organizations are still on a journey of delivering a digital experience for their customers.
For online, in particular, and as a starting point, it is probably worthwhile establishing how many customers across both the whole business — as well as those who are in, or have been in, collections —have either registered for online access or have downloaded your business app. Gaining this basic insight will help you introduce appropriate outbound campaigns that will help you manage future excessive customer demand. For example, notifications can be sent to app customers signposting them to different channels, including online. Alternatively, sending SMS or WhatsApp messages, with URLs, to registered online customers makes life easier for them to get to the point of resolution without having to pick up the phone.
5. What self-service capability do these channels offer them?
One of the great benefits for customers of having a wider choice of communication methods, regardless of channel type, is the ability to self-serve and resolve matters without having to speak with a live agent. These options should be reviewed on a frequent basis to ensure that they remain relevant, are being fully used by customers and are in line with business policy.
In my next post I’ll be taking a final look at the FICO and Censuswide customer survey as it relates to customers’ expectations when it comes to being contacted by businesses via proactive customer contact. In the meantime, if you have any questions regarding this post or would like to discuss ways that FICO can support you in improving your collections performance, please email me at huwvaughan@fico.com.
Popular Posts

Average U.S. FICO® Score at 716, Indicating Improvement in Consumer Credit Behaviors Despite Pandemic
The FICO Score is a broad-based, independent standard measure of credit risk
Read more
The GSE Data Is Public. Here's What It Shows About Credit Score Modernization.
Independent Milliman analysis of GSE historical data confirms what anyone can now verify directly: FICO® Score 10T is the most predictive score.
Read more
FICO® Score High Achievers: Is Age the Only Factor?
<p>FICO’s latest research on <a href="http://www.fico.com/en/blogs/risk-compliance/us-credit-quality-rising-the-beat-goes-on/" target="_blank">national FICO® Score distribution</a> shows that US credit quality continues to trend upwards, with an increasing number of consumers scoring in the highest scores ranges. Given that, we decided it was time to refresh our study on “<a href="http://www.fico.com/en/blogs/risk-compliance/infographic-what-does-a-high-credit-scorer-look-like/" target="_blank">FICO® Score high achievers</a>,” where we examine the credit behavioural profiles of consumers with higher credit scores.</p> <p>As expected, our latest study showed that older people generally have higher scores, as has been the case in our <a href="http://www.fico.com/en/blogs/risk-compliance/age-before-beauty-credit-worthiness-before-youth/" target="_blank">past research</a>. This is largely because they have trade lines that have been open longer, which leads to higher scores (assuming the trade lines are in good standing and all other things equal). The most credit savvy among you will remember that length of credit history accounts for roughly 15% of the overall <a href="http://www.myfico.com/CreditEducation/WhatsInYourScore.aspx" target="_blank">FICO® Score calculation</a>.</p> <p>But for younger consumers, it isn’t too helpful to say, “just wait until you are 50 years old, and that will fix things!” Thus, I decided to dive deeper with our analysis, including looking at the credit behavioural characteristics of younger consumers with high FICO® Scores.</p> <p>In this analysis, I looked at credit characteristics for the two highest score bands, 750-799 and 800-850, which have about 16% and 23% of the population, respectively. I further broke this down by looking at the characteristics of the youngest 15% in each group, which occurs at age 29 for the 750-799 group and 43 for the 800-850. We used FICO<strong>®</strong> Score 9 for our analysis, and examined typical variables of the categories that go into the make-up of the score.</p> <p><a href="http://www.fico.com/en/blogs/wp-content/uploads/2016/10/FICO-Score-High-Achiever-table.png"><img class="alignnone size-full wp-image-29367" src="http://www.fico.com/en/blogs/wp-content/uploads/2016/10/FICO-Score-High-Achiever-table.png" alt="fico-score-high-achiever-table" width="715" height="747" /></a></p> <p>Since there’s a lot to dissect in this chart, I’ll highlight a few findings that struck me: <ul> <li><strong>Credit history.</strong> Higher scores are undoubtedly associated with a longer time on file. What’s striking is the higher average time on file for the 800+ group, both overall and for revolving accounts (the most common trade line). Clearly, it helps to start credit use early in life – but that’s not the sole determining factor for high scoring. The younger cohorts in both the 800+ and 750-799 groups have time on file medians significantly less than their older counterparts.</li> <li><strong>New credit.</strong> High credit scorers do, in fact, pursue new credit. We see little variation in months since last trade line opening and last inquiry among all groups observed.</li> <li><strong>Pay on time.</strong> As you might expect, the further in the past the delinquency, the higher the score – and that’s <u>if</u> a delinquency ever happened. 95% of the 800+ people and 72% of the 750-799 group have never been delinquent, which is a striking contrast to the 57% for the total population. The percentages for the younger groups are even higher, especially so for the 750-799ers. Collection items are also scarce for these high scorers. While 23% of the national population have collection items greater than $99, the figures are only 0.5% for the 800+ group and 3% for the 750-799 group. It is clear that, in conjunction with starting a credit file early, paying on time is a key trait of the FICO® Score high achiever.</li> <li><strong>Balance and utilization.</strong> Finally, we look at how credit is being used, focusing on revolving product use. (Since most people only have one mortgage or one auto loan, variation in instalment product figures is minimal and driven by payment history, which is near perfect for high scorers, as we’ve seen.) FICO® Score high achievers tend to have more open revolving accounts. While the % active trades and utilization are generally lower, by no means do high scorers avoid the use of credit products. What drives the difference here is the amount of <u>available</u> revolving credit utilized. The 800+ group is roughly 1/4 of the national median, both in total and on their highest utilized card; they also have lower balances and more cards<em>. </em>The 750-799 group is more active and higher utilized, but still only at 2/3 of the national figures. The young 750-799 group compensate with lower revolving balances and, as a result, lower utilization, which is in line with what we see for the 800+ group.</li> <li><strong>Benchmarks.</strong> I’d like to point out that while this study provides good benchmarks of the typical credit traits of the FICO® Score high achiever, individual credit profiles will vary widely. And keep in mind that when we sort groups of consumers as a whole by different behaviours, some results may look superficially odd. For example, the 800+ band has a longer median average open account time (128 months) than average revolving months on file (140 months).</li> </ul> So, what do we conclude? A huge takeaway is that high scorers don’t have too much in the way of serious delinquencies and negative public record data.</p> <p>In most respects, the young 800+ people are like their peer group. They really only differ markedly in their shorter credit history and higher non-mortgage balance, both of which are a function of life stage. Our results show that you don’t have to be a credit product hermit; these high scorers have more credit cards. The takeaway is to start credit activity early and maintain well-managed and moderate usage.</p> <p>In many ways, the young 750-799 people are more interesting because their age profile is much younger. Their credit characteristics differ more from their peer group, particularly in terms of length of credit history. They compensate by having almost pristine credit records and lower balances.</p> <p>Ultimately, 39% of US consumers are FICO® Score high achievers, which they accomplish by following common-sense credit practices. It ain’t rocket science!</p>
Read moreTake the next step
Connect with FICO for answers to all your product and solution questions. Interested in becoming a business partner? Contact us to learn more. We look forward to hearing from you.