A Deep Dive into the Distribution of the FICO Score Across the US
What states and cities have the highest average FICO Score?


FICO research points to a trend indicating that the average FICO® Score on the U.S. population has been gradually increasing since coming out of the “great recession” of the mid to late 2000’s.
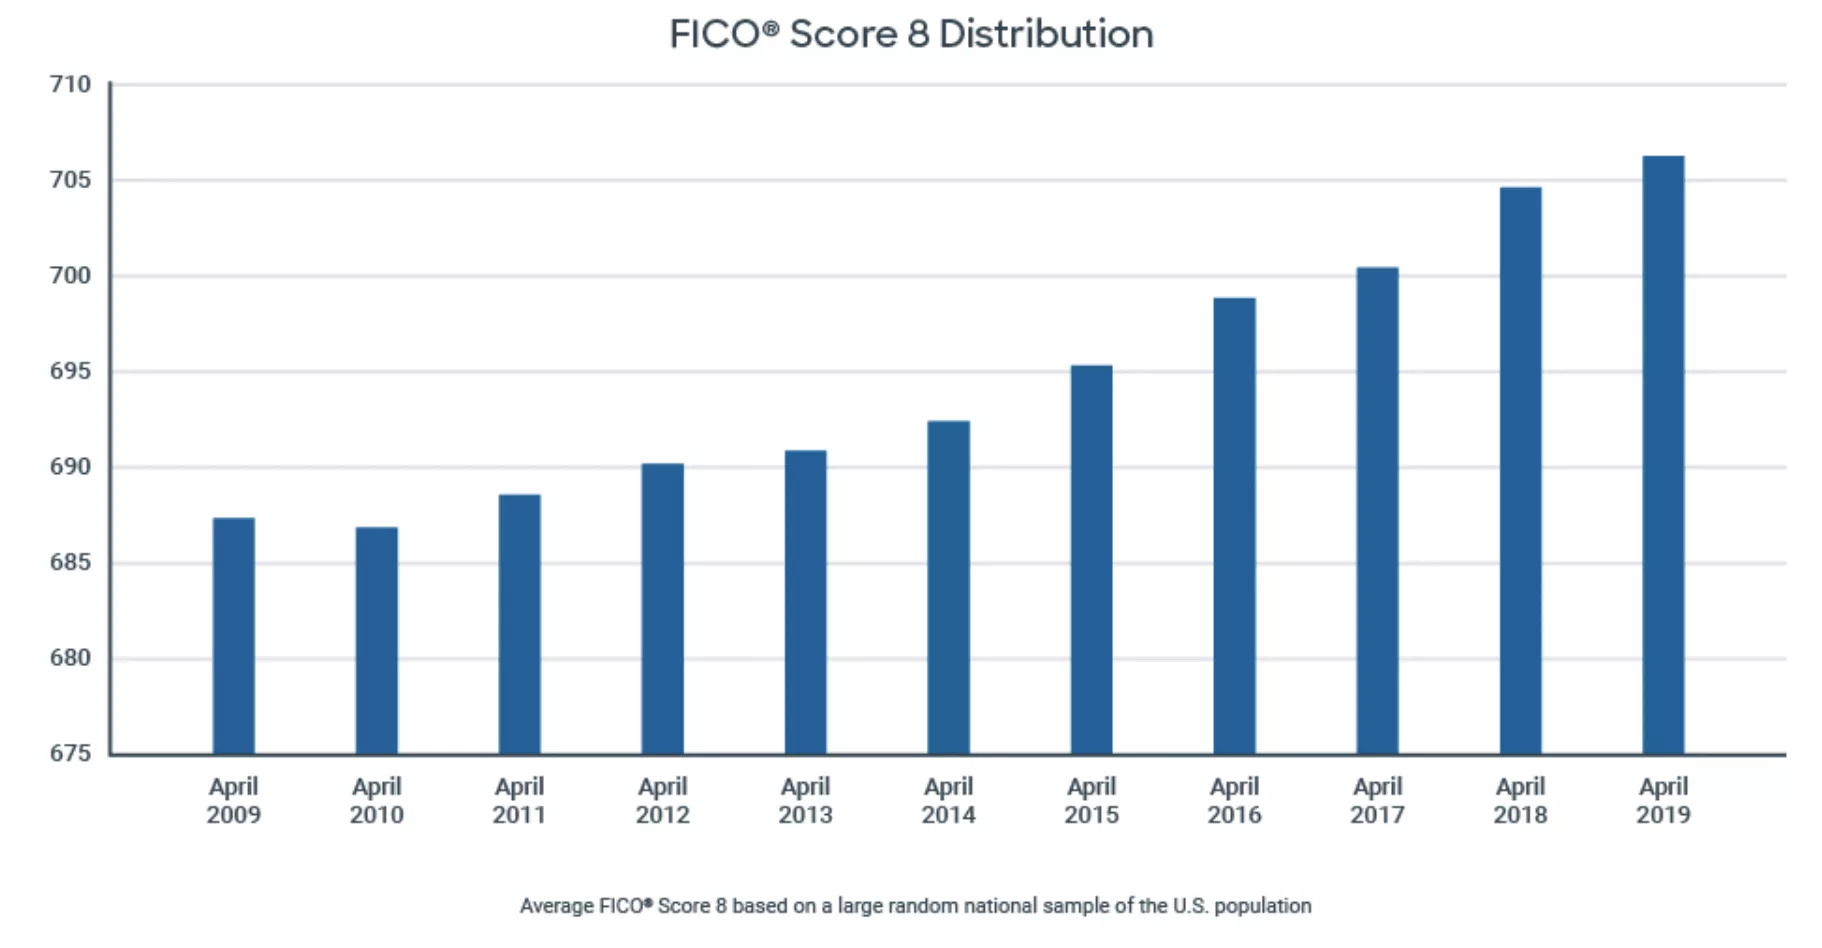
There are many factors which may be contributing to this. In general, we are seeing a decrease in negative information on credit reports in these more recent time periods, which may be one factor contributing to the increasing average scores. One driver of this observation is likely the FCRA-mandated seven-year purge rule for negative information, which means that missed payments reported in the 2007-2009 period (epicenter of the recession) have been dropping off of people’s credit reports. In addition, The Fed has highlighted that consumer credit scores in the lower score ranges may have benefitted over the past several years from efforts by the credit reporting agencies to refine collection reporting practices on consumer files.
Another theory is that people’s exposure to their credit reports and FICO® Scores, like seeing their updated FICO® Score on their monthly credit card statements, may have increased awareness and resulted in more prudent management of their personal finances.
Whatever the reasons, having a higher FICO® Score helps individuals gain access to more credit options at more affordable rates¾potentially saving them thousands of dollars in interest charges.
So, while the average FICO® Score is increasing over time at the national level, what about at the state or city level? Which states have seen the biggest increase over time? How do major U.S. cities compare? Which state residents carry the most credit balances? Which major city residents are applying for credit most frequently?
Not that this is a competition per se, but some noteworthy FICO® Score-related findings may give you some “credit bragging rights” depending on which state or city you live.
State Level View
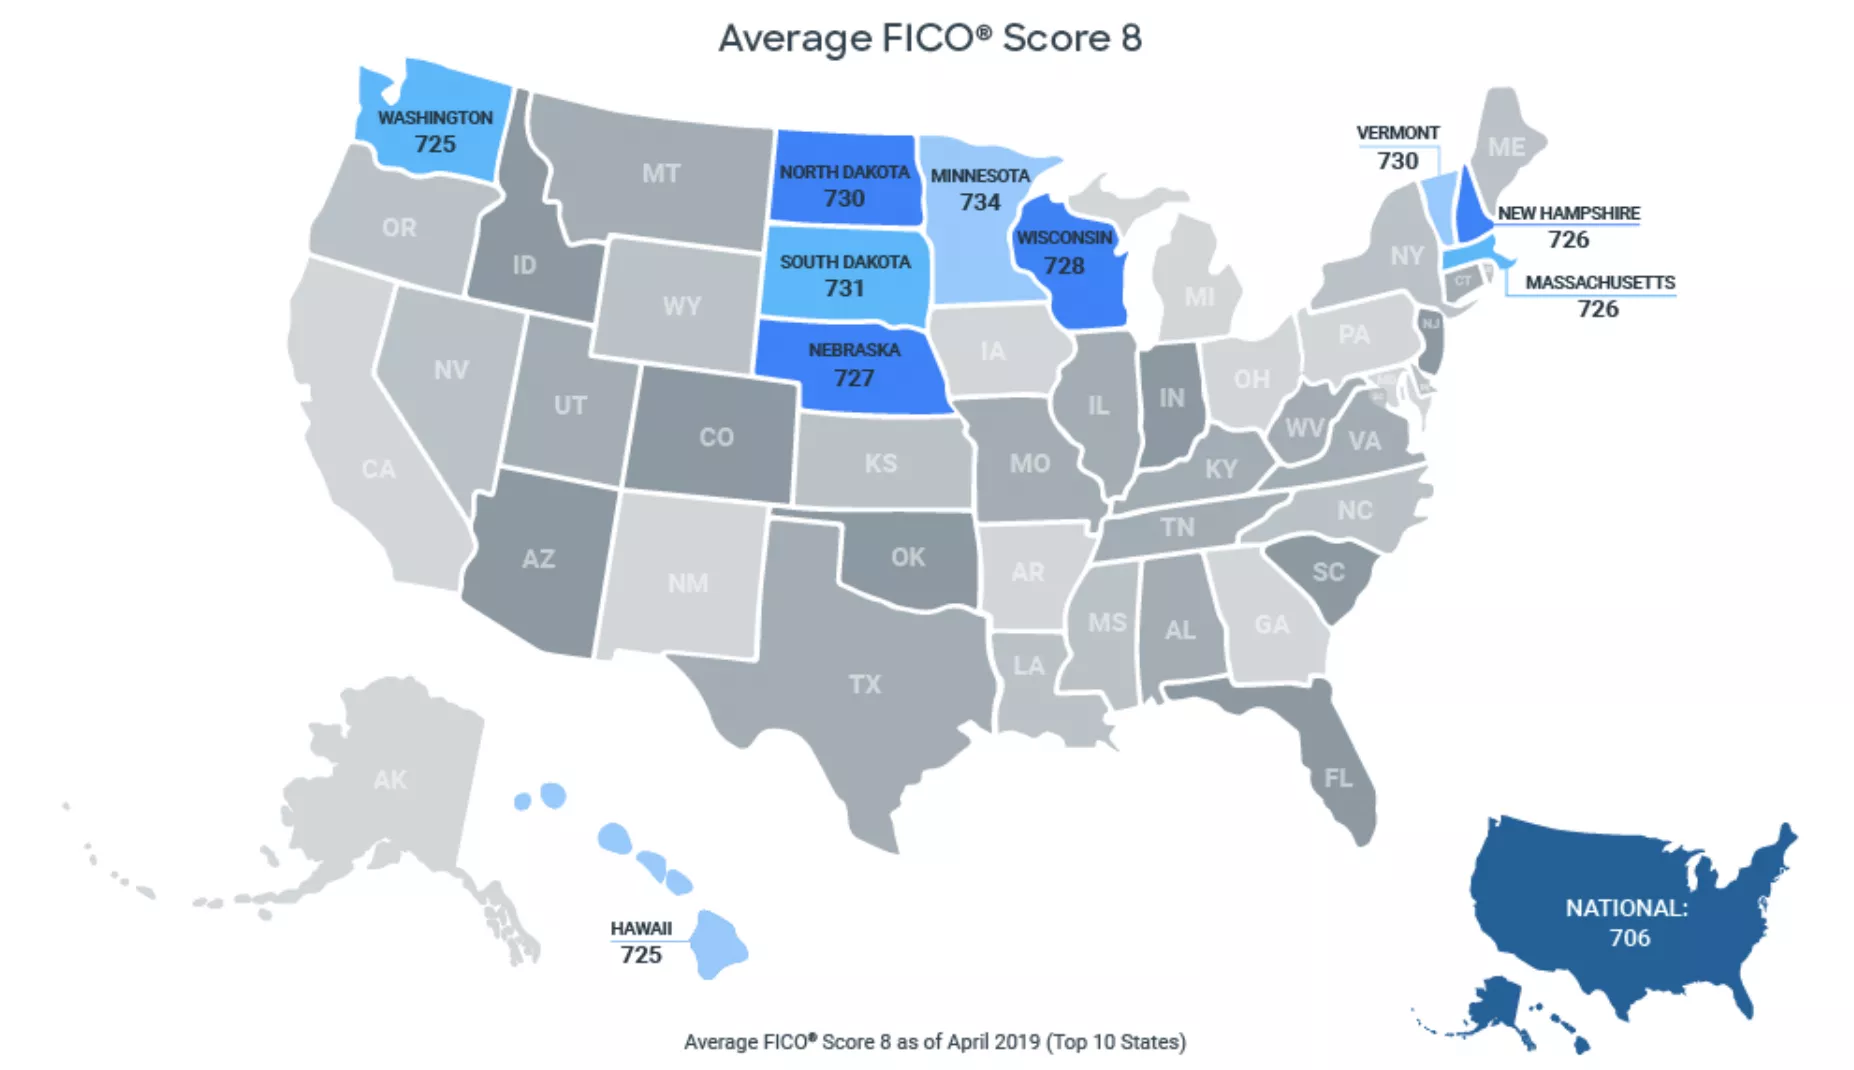
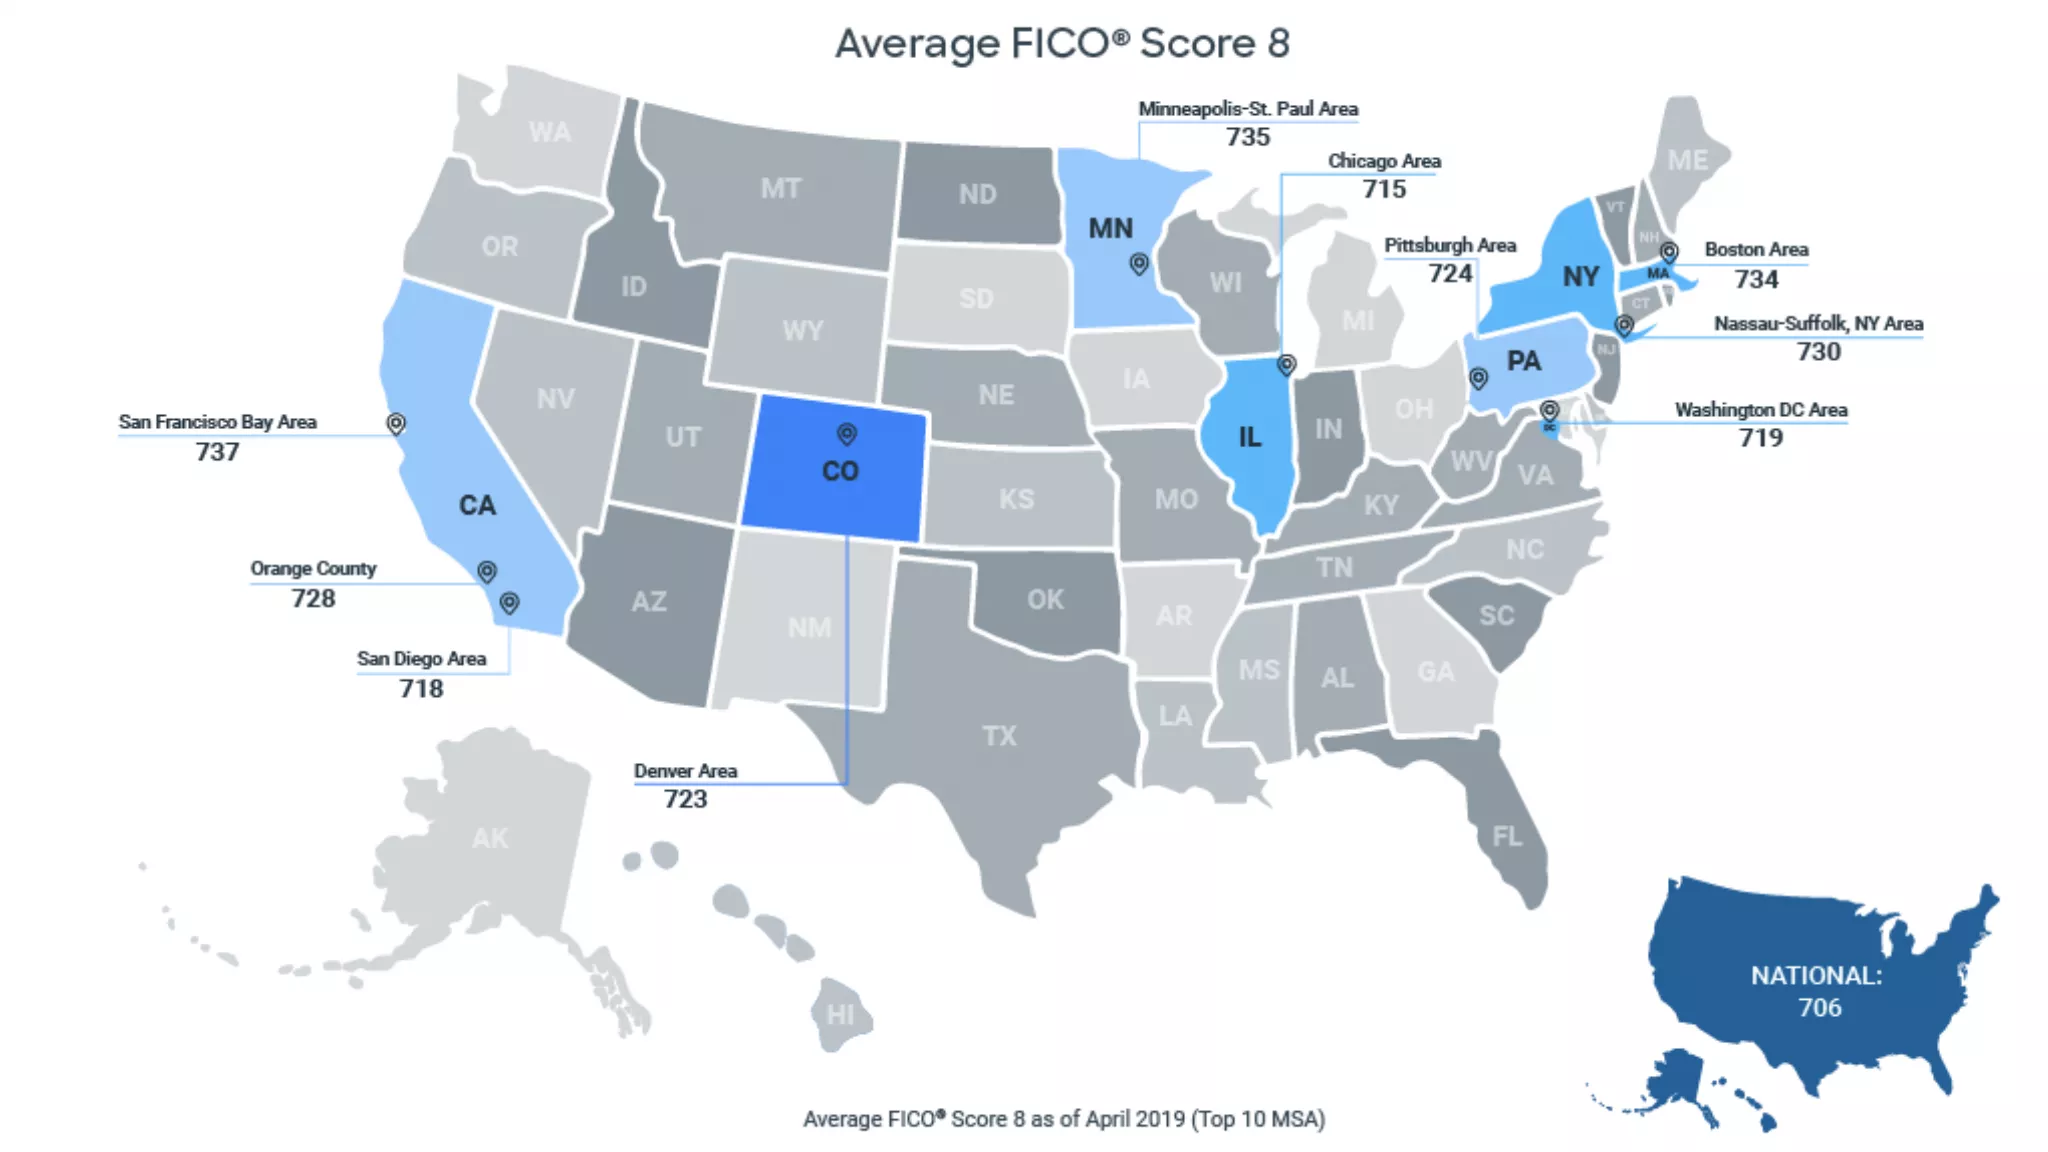
The average FICO® Score for the U.S. as of April 2019 is 706. While 31 states (and the District of Columbia) have an average score higher than the national average of 706, we generally see that the Midwest and New England states have the highest average FICO® Scores. Minnesota, South Dakota and North Dakota are almost 30 points higher than the national average, coming in at 734, 731 and 730.
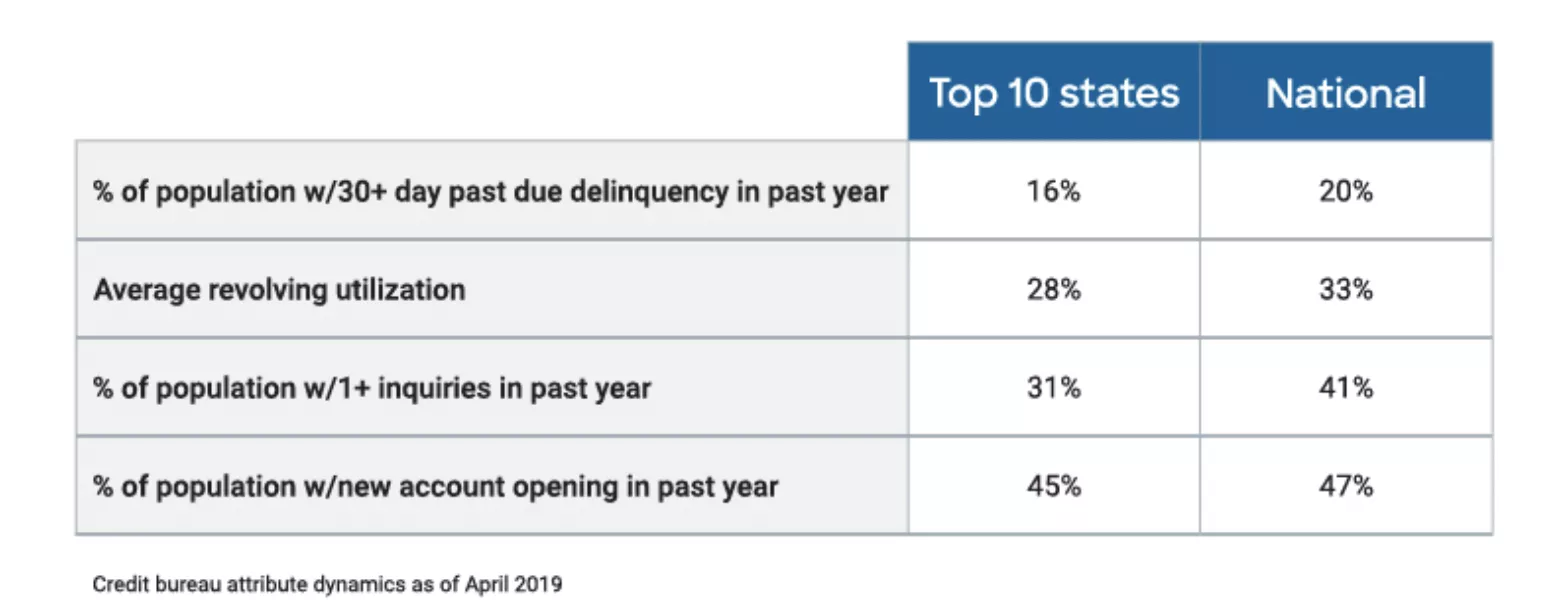
On average, residents in these states are likely to have fewer missed payments, are less likely to be seeking credit, and have lower revolving utilization, which are behaviors that reflect positively on a FICO® Score. For example, the chart below illustrates different credit profile dynamics for the top ten states with the highest average FICO® Scores compared to the national view.
The states with the highest average FICO® Scores had a lower percentage of their population with a recent delinquency, a greater percentage with lower revolving utilization ratios, and had fewer residents seeking and obtaining new credit as dimensioned in the table below – thus contributing to their higher average score results.
Average FICO® Scores have increased in all 50 states since the great recession!
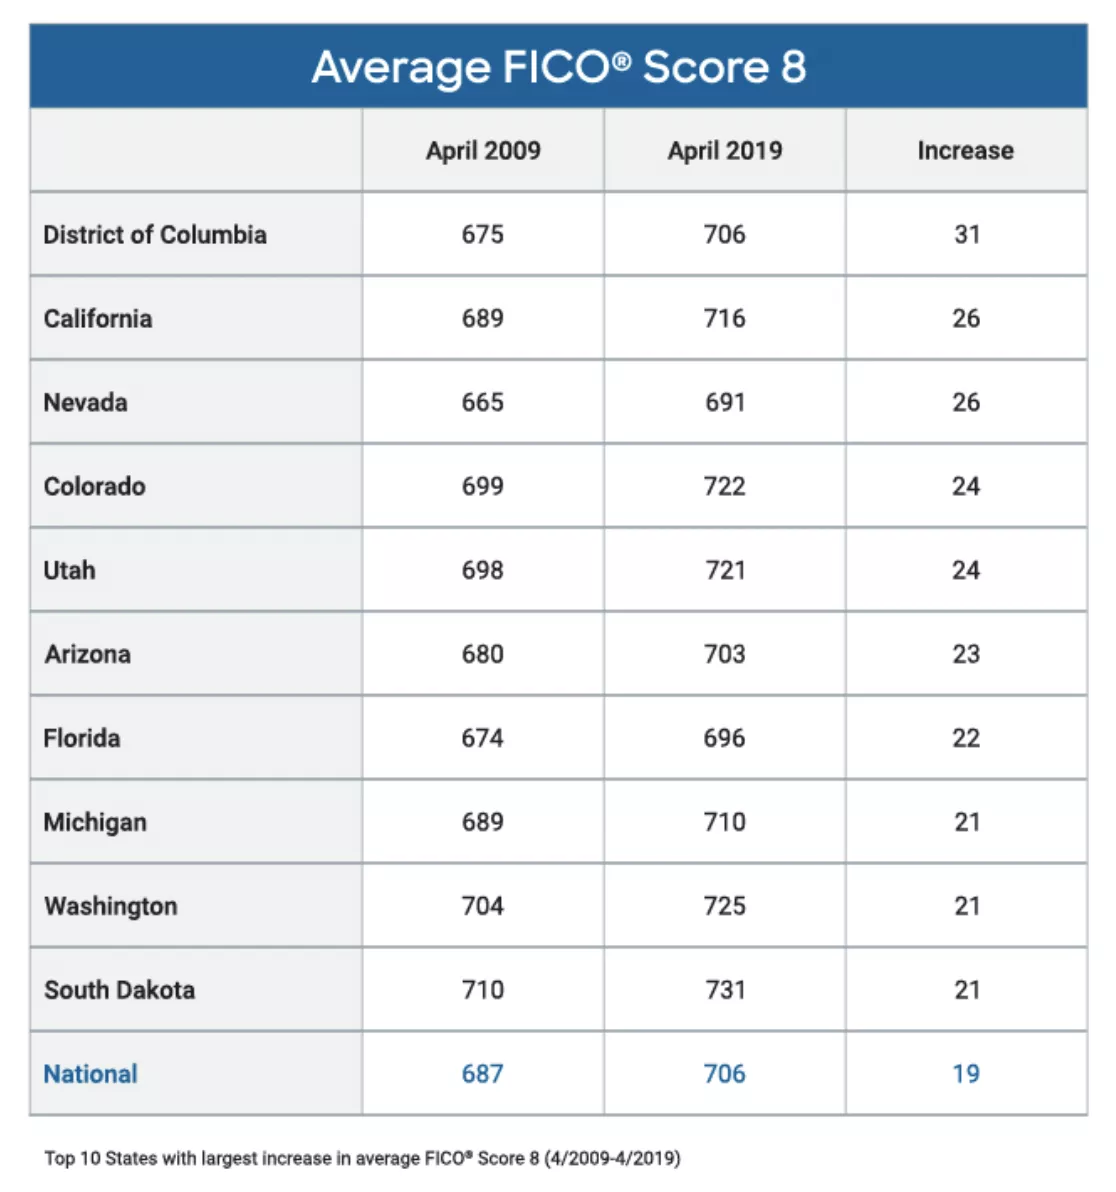
Encouraging news for everyone -- all 50 states (and the District of Columbia) have seen their average FICO® Scores as of April 2019 increase when compared to their average scores at the height of the great recession period (2009-2010).
Western states and some of the other states substantially impacted by the recession tend to demonstrate greater increases in the average FICO® Score over time.
MSA1 (City) Level View
The San Francisco Bay Area has the highest average FICO® Scores as of April 2019, at 737, closely followed by Minneapolis/St. Paul and Boston. Las Vegas, San Antonio and Miami had the lowest average FICO® Scores (687, 680 and 678 respectfully) of the MSAs we evaluated.
Similar to the state level analysis, residents in these MSAs are likely to have fewer missed payments, are less likely to be seeking credit, and have lower revolving utilization, which are behaviors that reflect positively on a FICO® Score.
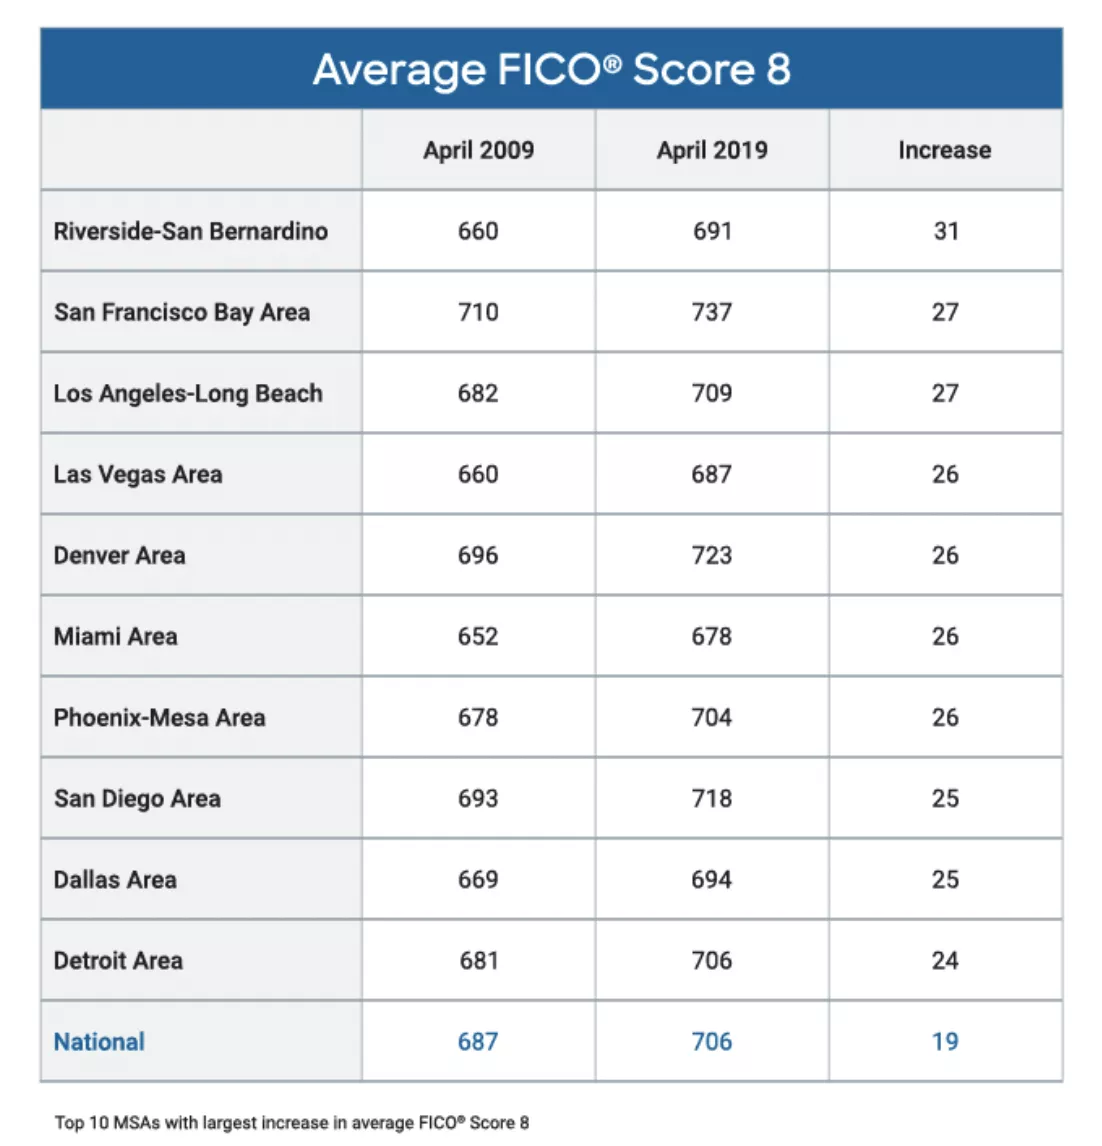
MSAs have also seen their average FICO® Scores increase since the great recession!
In terms of score improvement over the 10-year time period (April 2009-April 2019), MSAs heavily impacted by the recession and housing market “bust” observed the largest increase in average FICO® Score over that time period. As shown in the table below, Riverside-San Bernardino CA, Las Vegas and Denver were in the top five cities with the largest increase in average FICO® Scores. Hard-hit MSAs such as Las Vegas, Phoenix and Detroit have also seen substantial increases in their average FICO® Scores over the past 10-year period.
This points to an important fact about credit scores – they are dynamic and will change as the underlying credit behaviors change. And increasing one’s credit score from the mid 600’s to the low 700’s can have a substantial impact in terms of increasing the likelihood of being approved for a credit application and the interest rate assigned.
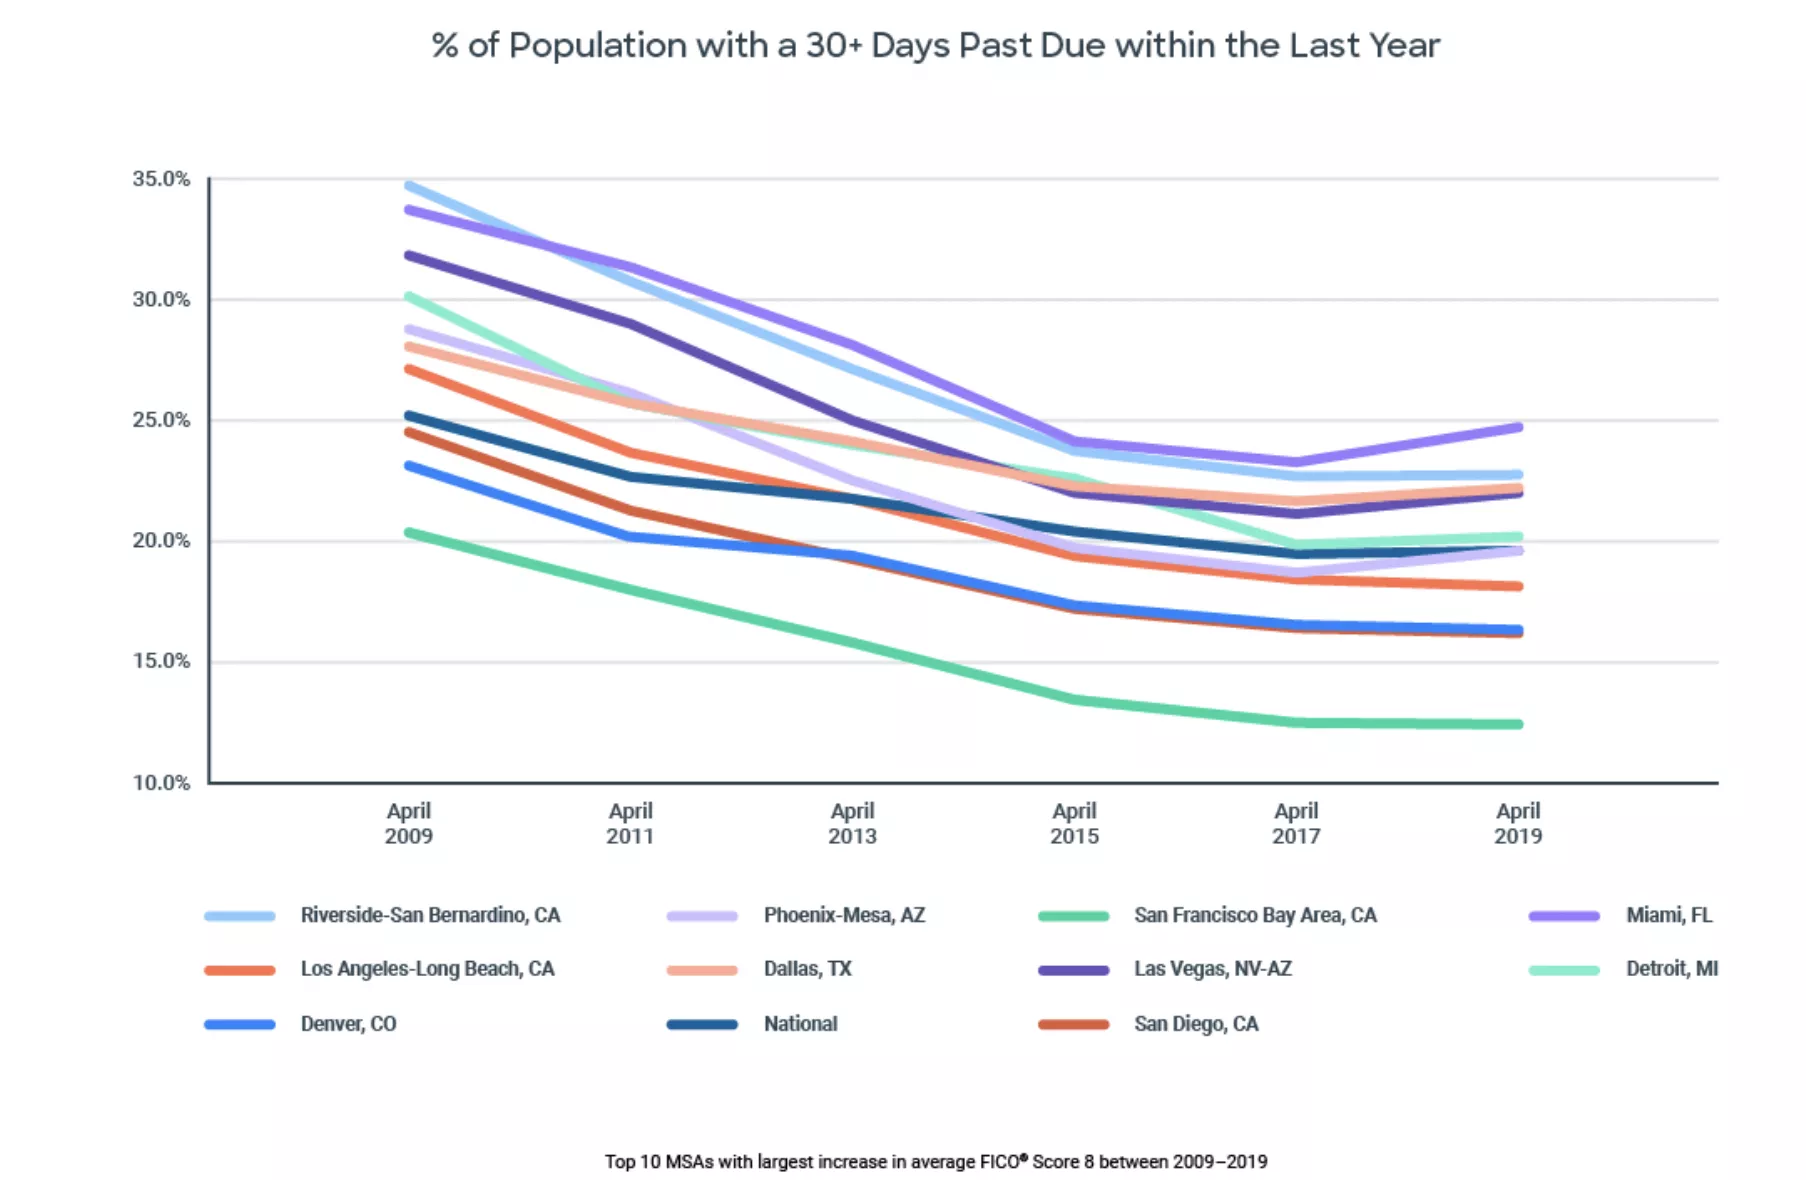
As mentioned above, credit blemishes posted during the recession are now starting to drop off credit reports and this could be contributing to this trend of average score increase in more recent time periods. In addition, the percentage of individuals with recently missed payments has also decreased over time.
For example, the chart below plots the percent of population with one or more accounts reported as 30 days past due within the past year. For each of the top MSAs, the data shows a substantial decrease over the 10-year period in the percent of population having a recent delinquency. As payment history is the most important of the five FICO® Score categories (comprising 35% of the score calculation), it has significant impact on a FICO® Score – in this case, the reduction in recent delinquency is helping to contribute to the increase in average score being observed.
Additional Trends Evaluated
Other interesting comparisons regarding some of the underlying credit dimensions that help explain the FICO® Score dynamics being observed:
- As of April 2019, the average total credit account balance (mortgage balances excluded) being carried by people at the national level is around $20,484 and the average mortgage balance is around $209,000. Can you guess the states in which residents carry the highest and lowest average total credit account balances?
- Texas, Maryland, and Georgia have the highest average non-mortgage balances being reported as of April 2019.

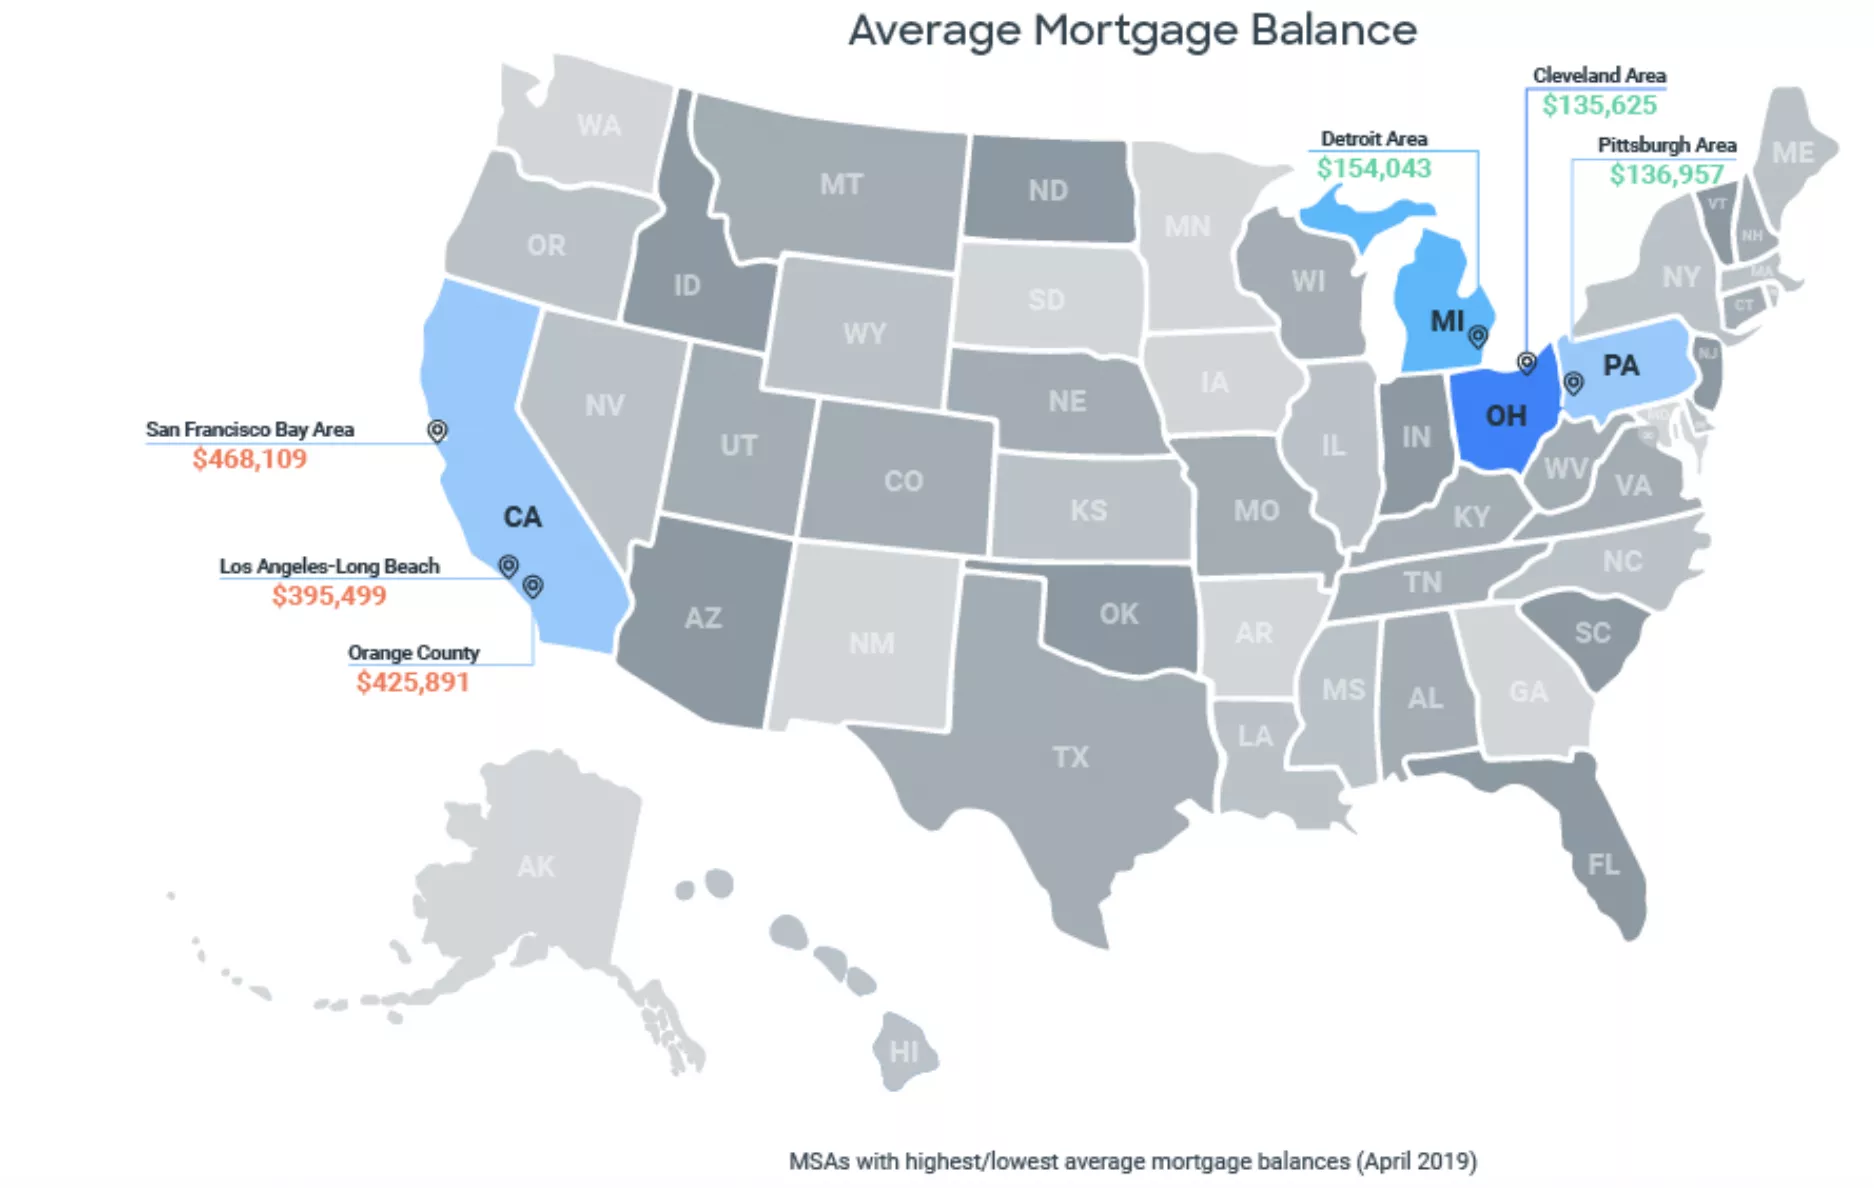
When looking specifically at mortgage related balances in April 2019, it’s not surprising that states known for expensive real estate make up the top five. Looking for a lower housing cost? Arkansas, Mississippi and West Virginia have the lowest average mortgage balances being reported ($127,140, $122,666 and $114,759).
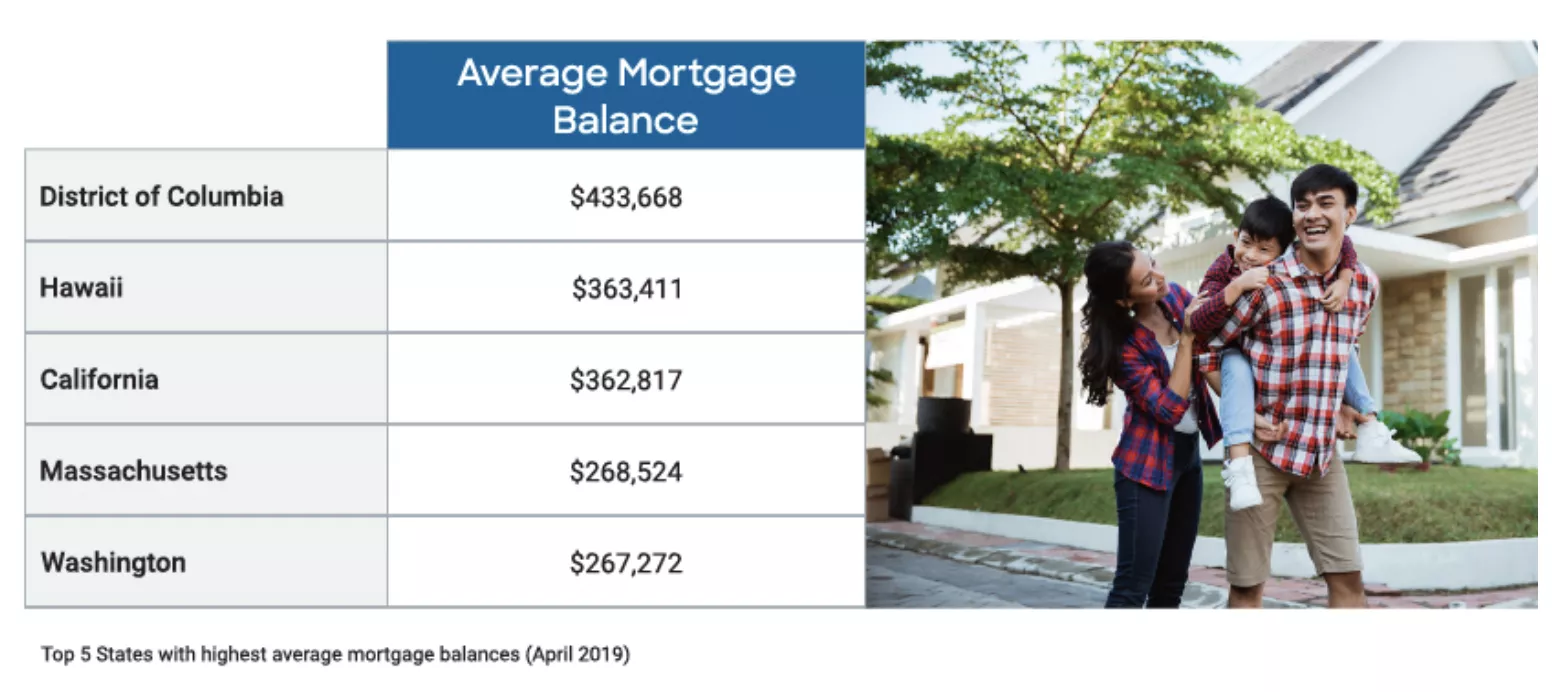
West coast MSAs have higher average mortgage balances
In fact, when diving into the MSA level, we see that the average total real estate balances for the San Francisco Bay Area and Orange County, CA are two times greater compared to the U.S. national average of $209,000 and around three times greater compared to the MSAs we evaluated with the lowest average total mortgage balances. Nice year-round weather and a hot job market comes at a cost!
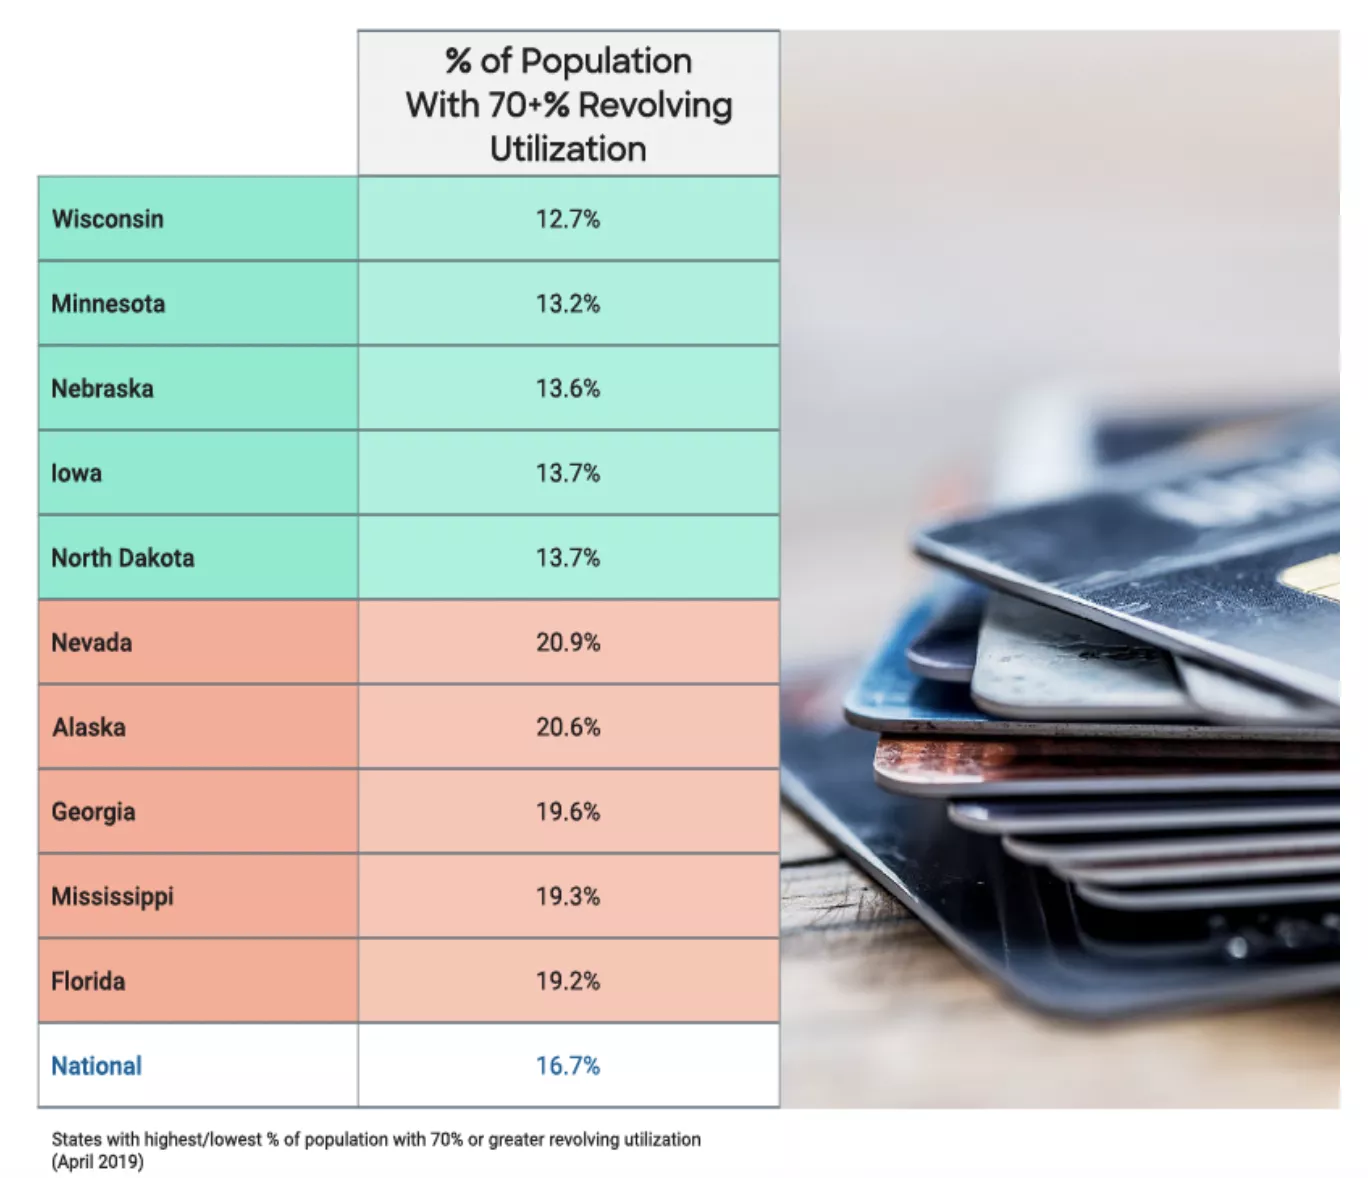
How much of one’s available credit is being used (commonly referenced as “revolving utilization percentage”) is an important credit behavior evaluated in a FICO® Score calculation. The higher the percent of available credit being utilized, the greater the risk. This is a key driver in the “amounts owed“ FICO® Score category, which consists of 30% of the score calculation.
At the national level, we see that close to 17% of the population have a relatively high revolving utilization of 70% or greater as of April 2019. Midwest states tend towards having a smaller percent of their residents with higher revolving utilization – the top five states averaging around 13% of their residents having 70% or greater utilization as of April 2019. On the flip side, Nevada and southern states are more likely to have a higher percentage of their people with 70% or greater revolving utilization. Note, most states have seen the percentage decrease modestly when comparing to the 2009-2010 time period, helping contribute to the higher average scores in the more recent time periods.
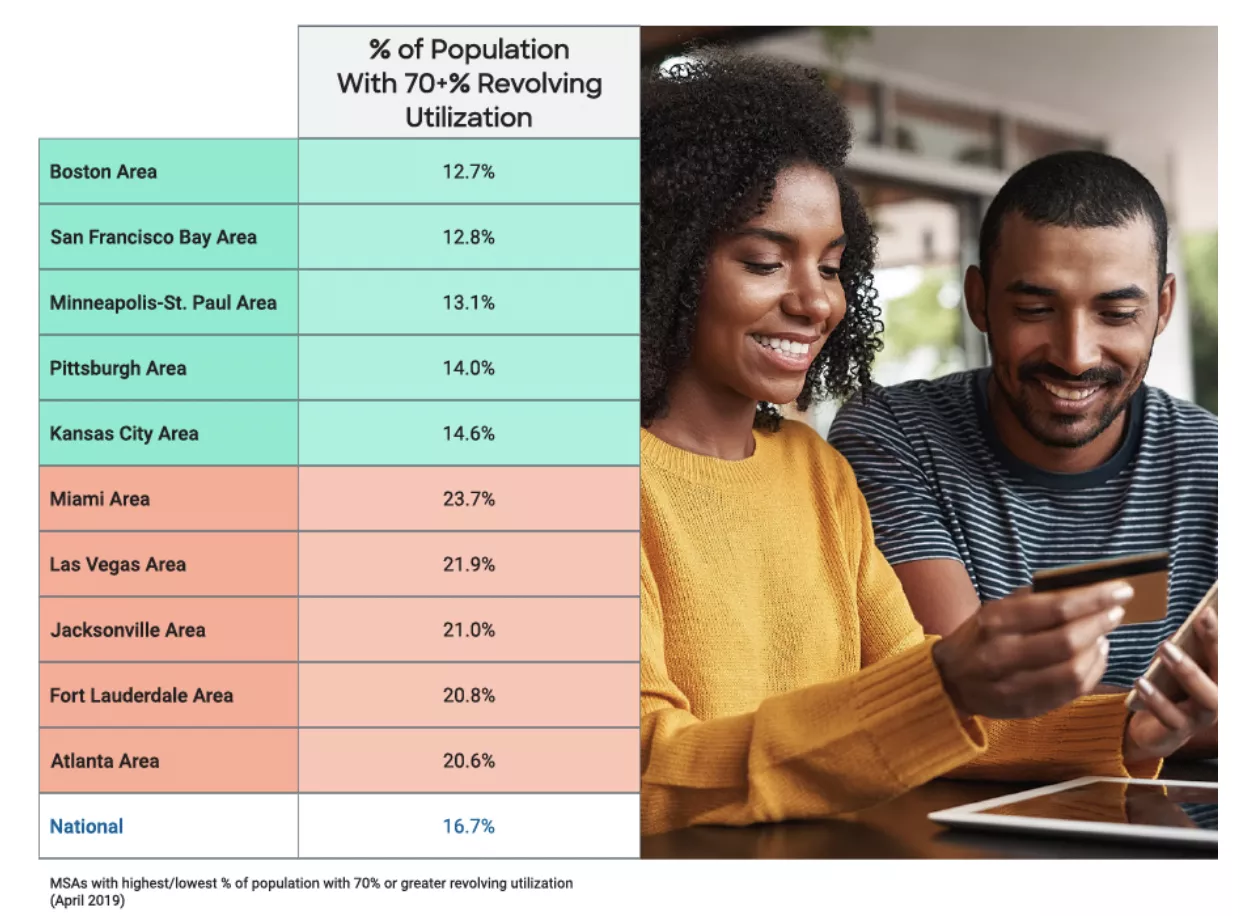
At the MSA level, we see similar trends. Las Vegas and large cities in the southern states are more likely to have a higher percentage of their residents with 70% or greater revolving utilization, which is contributing to their lower average credit scores. Cities with a lower percent of their residents being 70% or greater utilized also tend to have higher average FICO® Scores.
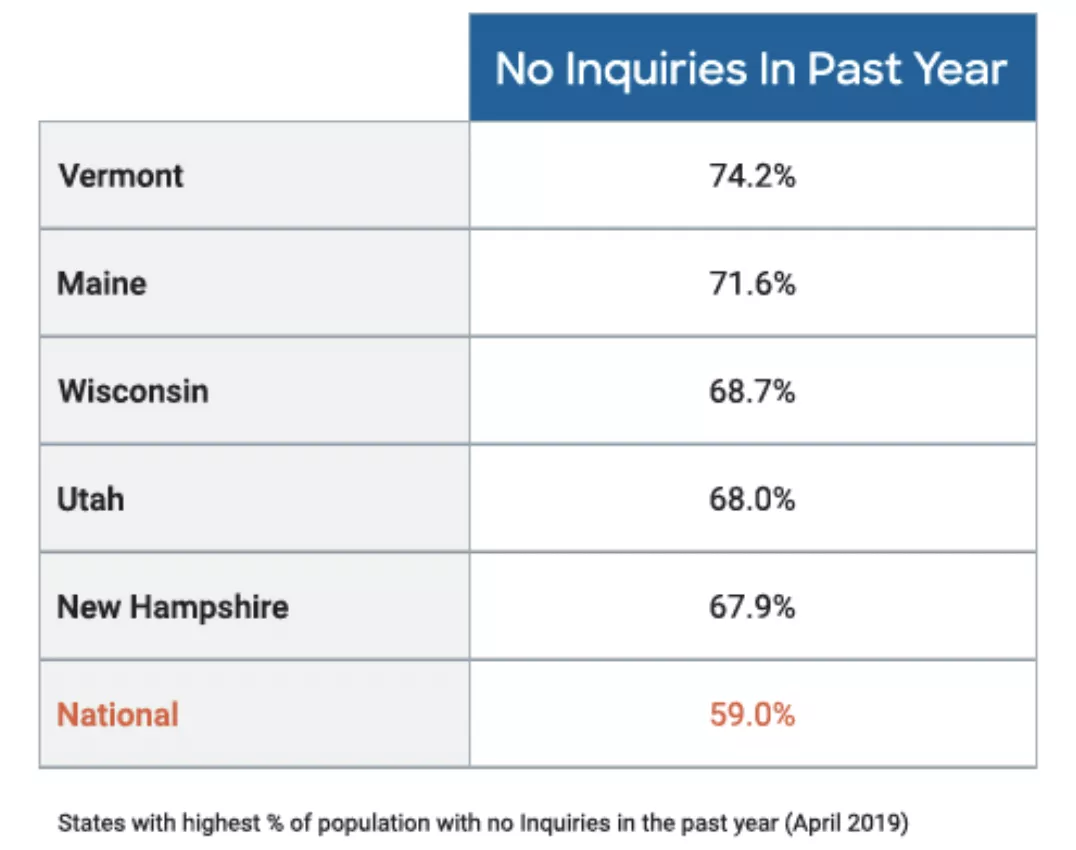
Credit seeking activity can also affect one’s credit scores, impacting the “length of credit history“ and “pursuit of new credit“ FICO® Score categories.
Generally speaking, the percentage of population seeking new credit (resulting in hard inquiries) dipped somewhat after the recession hit but has remained fairly stable since then through April 2019. The perception about New Englanders being more financially conservative may be true from a credit perspective, as three of the top five states with highest percent of population with zero inquiries in the past year are located in that part of the country.
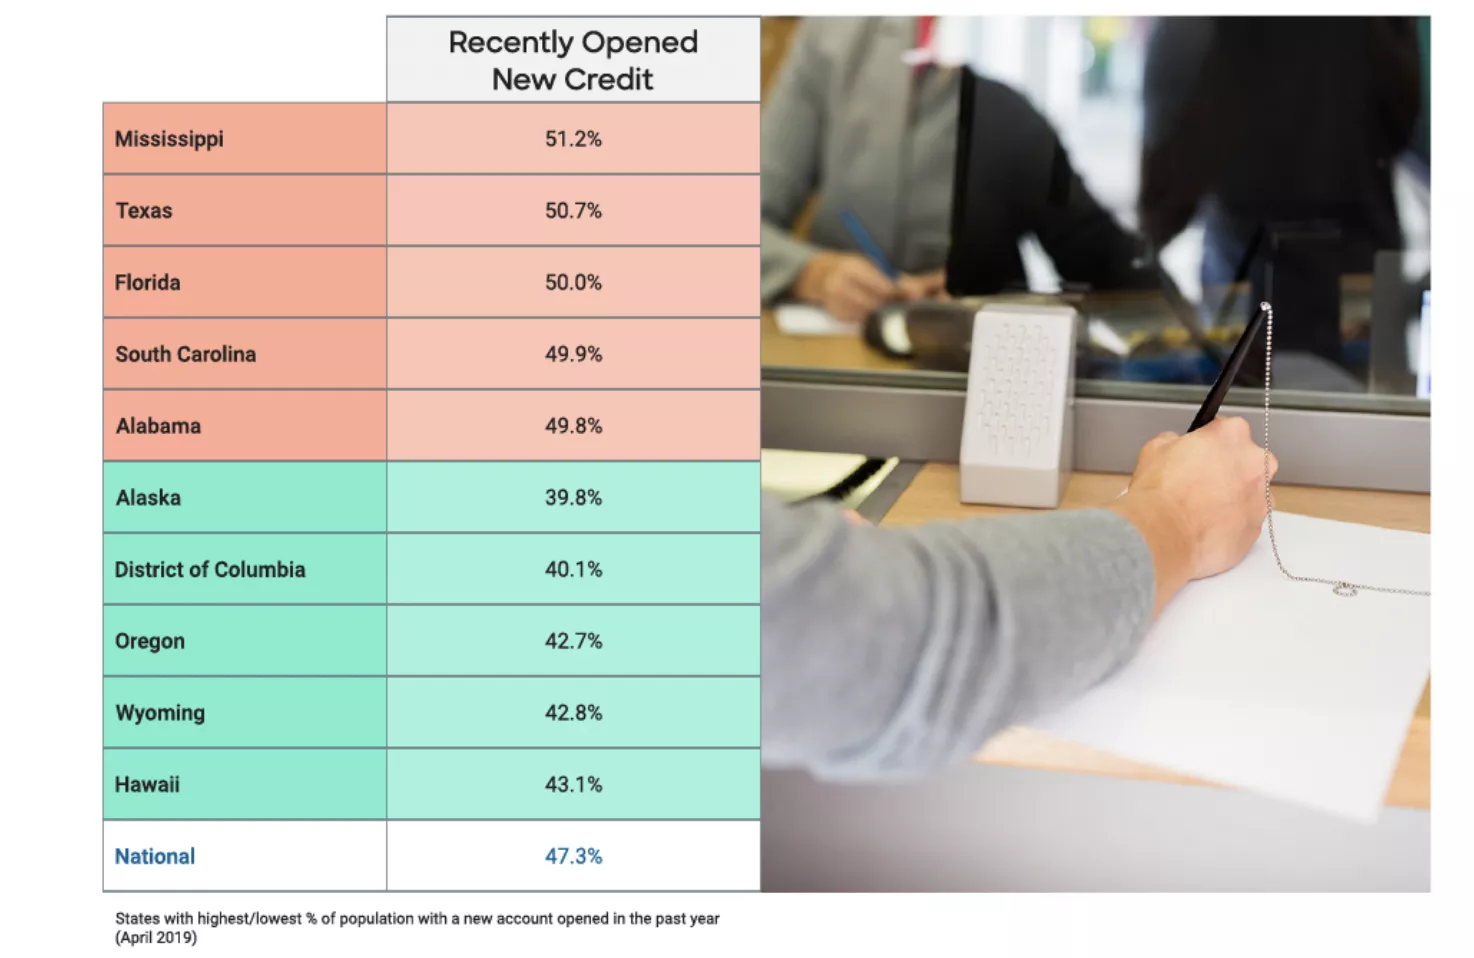
Consumer credit continues to play an important role in the U.S. economy, and the majority of Americans tend to be credit active (using credit and securing new credit). As of April 2019, close to 50% of consumers opened new credit in the last year. The percent of people in southern states who recently opened a new credit account was the highest, but only slightly higher than the national average. The opening of new credit can negatively impact credit scores as it impacts time-in-file attributes.
State level view
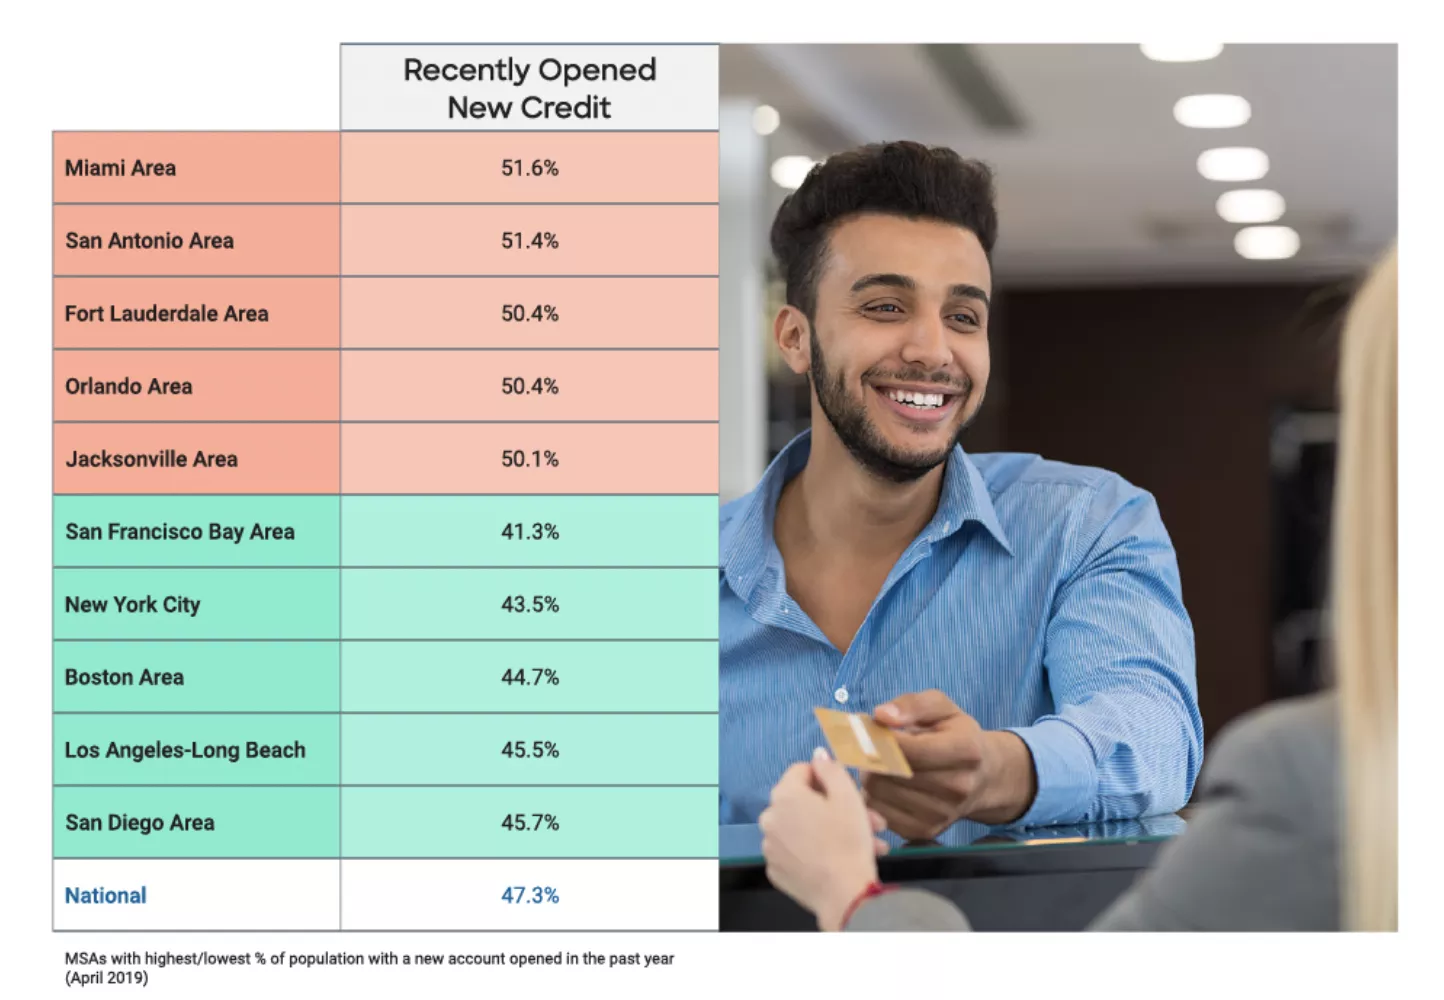
Similar trends were observed at the MSA level view
While it’s fun to compare and contrast FICO® Score and credit attribute dynamics between the states and cities, it’s important to remember that the information shared in this report is aggregated across all consumers in those regions. There are residents in each state and MSA who span the full spectrum of values for these credit attributes and FICO® Scores.
And remember, information about where one lives (such as state, county, ZIP code) is never considered in a FICO® Score. FICO® Scores are calculated based solely on how one manages their credit whether they live in the Big Apple, the Land of Lincoln, or Big Sky Country.
-----------------------------------------------------------------
1MSA (Metropolitan Statistical Area) is a geographical region with a relatively high population density at its core and close economic ties throughout the area. For this blog, we evaluated 33 MSAs.
All metrics are generated on a large random national depersonalized sample of the U.S. population unless noted otherwise.
All FICO® Score metrics are based on FICO® Score 8.
Popular Posts

Has the Reporting of Rental Data to the Credit Reporting Agencies (CRAs) Increased?
FICO Score 10T includes rental data, but consumers can only experience the benefit of this to the extent that their rental data is reported to the CRAs
Read more
FICO Statement on FHFA and FHA Updates to Credit Score Modernization
FICO supports FHFA’s announcement that the long-anticipated historical data for FICO® Score 10T will be released to the mortgage market.
Read more
Average U.S. FICO® Score at 716, Indicating Improvement in Consumer Credit Behaviors Despite Pandemic
The FICO Score is a broad-based, independent standard measure of credit risk
Read moreTake the next step
Connect with FICO for answers to all your product and solution questions. Interested in becoming a business partner? Contact us to learn more. We look forward to hearing from you.