FICO® Resilience Index - Benchmarking Portfolio Resilience
Highlighting results from FICO’s release of FICO® Resilience Index benchmarking reports for 2022

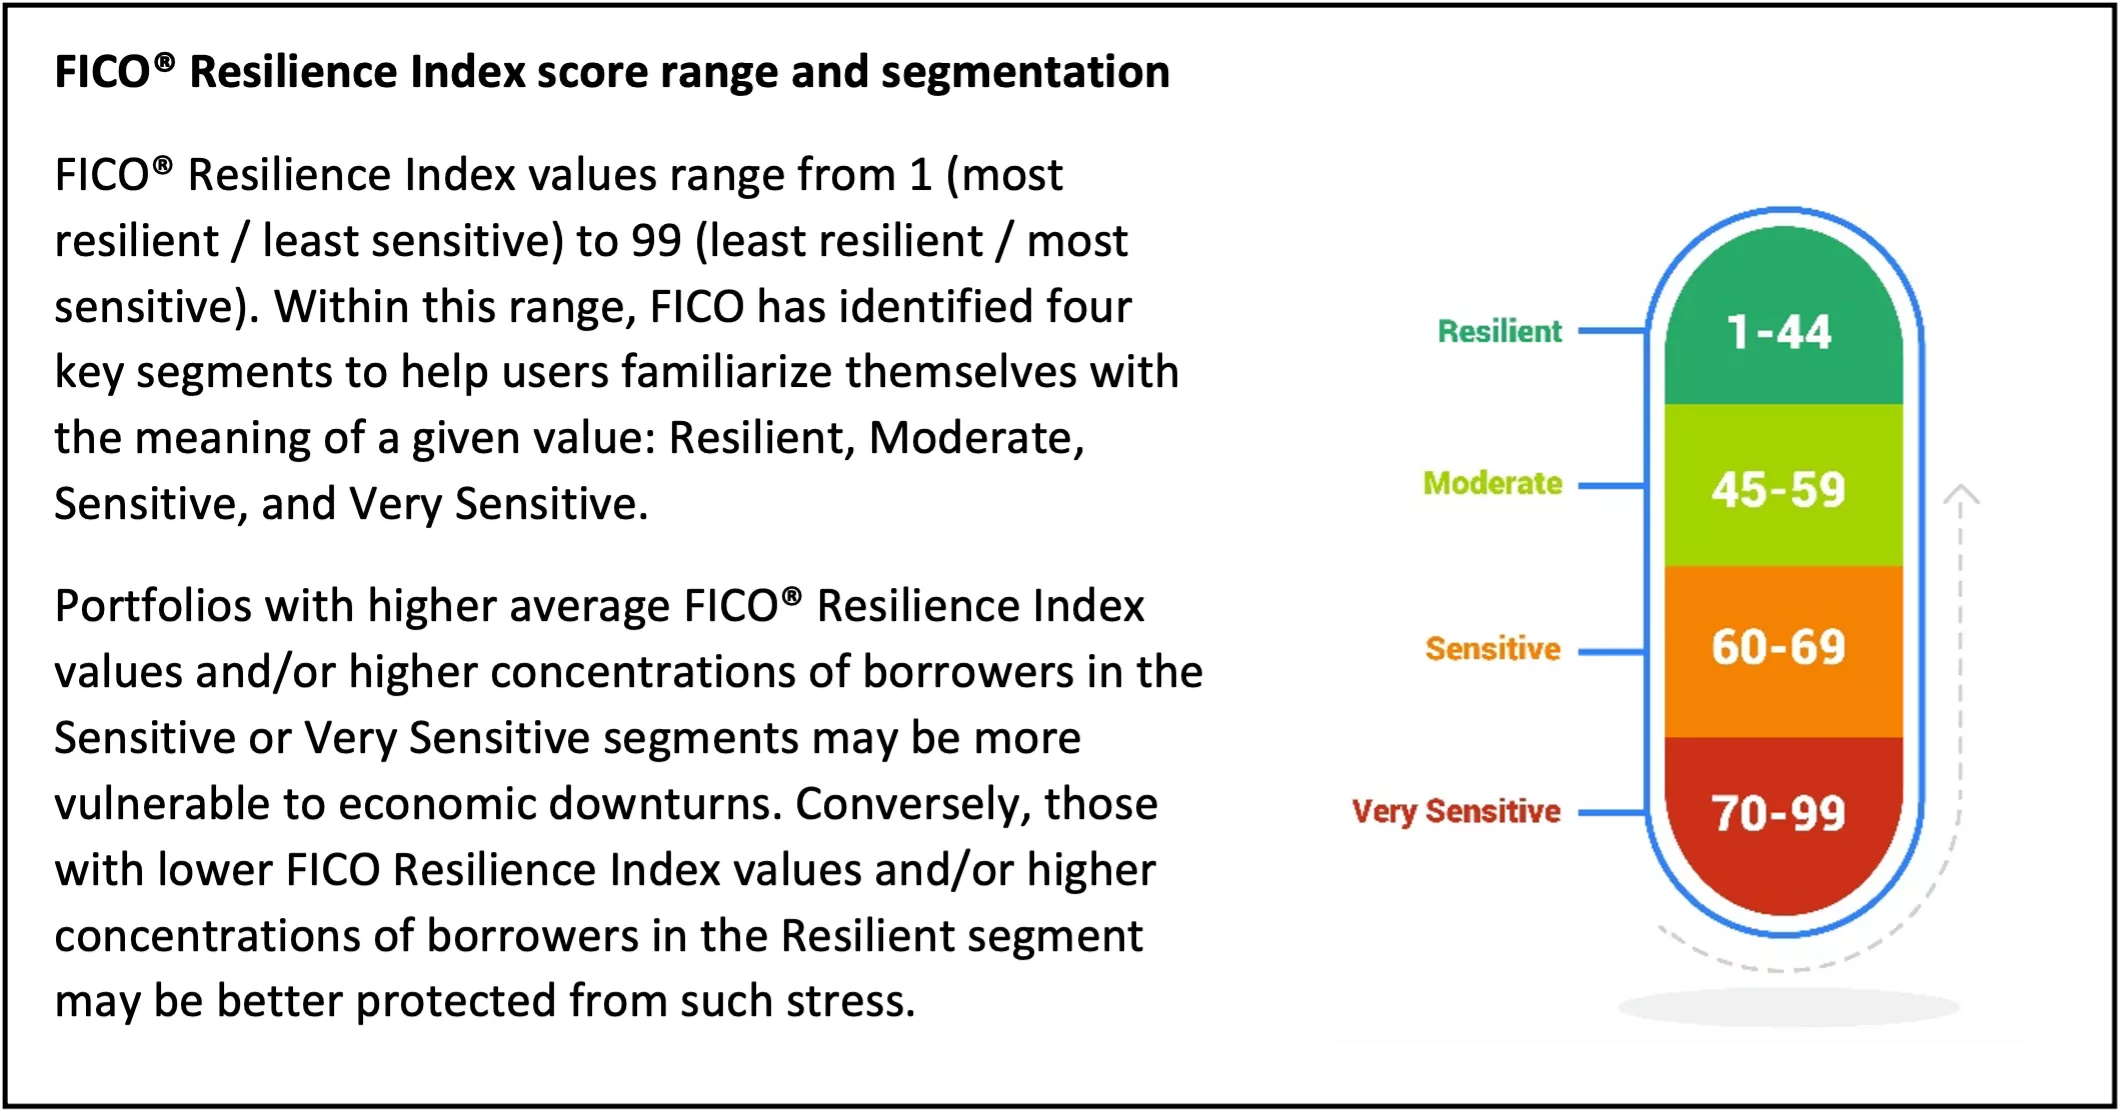
FICO recently released its second set of FICO® Resilience Index benchmarking reports, revealing interesting insights and trends about lending portfolio resilience over time. FICO Resilience Index is designed to rank order consumers with respect to their resilience to severe economic stress. These benchmarking reports compare the distributions of new and existing accounts across different portfolios (and at the consumer-level). Spanning a series of five industry snapshots between 2007 and 2022, these analyses give lenders the ability to identify strengths and potential vulnerabilities in their resilience profiles relative to the industry’s.
We can infer from these analyses that consumer sensitivity levels respond to the actions and attitudes of both lenders and borrowers. As measured by FICO® Resilience Index 2, borrowers entered the Great Recession with historically high sensitivity, possibly influenced by more lenient lending practices and less restrained borrowing. In contrast, both new and existing borrowers in 2013 had historically low sensitivity levels, following years of conservative post-recession lending and borrowing.
Impact of borrower sensitivity on default rates in stressed economy
As seen in Figure 1, the impact of higher sensitivity on borrower repayment behavior was material during the Great Recession. Across all FICO® Score ranges, the most sensitive 20% of borrowers significantly underperformed the most resilient 20%. Portfolios with below-average resilience levels would therefore likely have experienced higher credit losses through the Great Recession compared to those with a similar FICO Score profile but higher resilience.
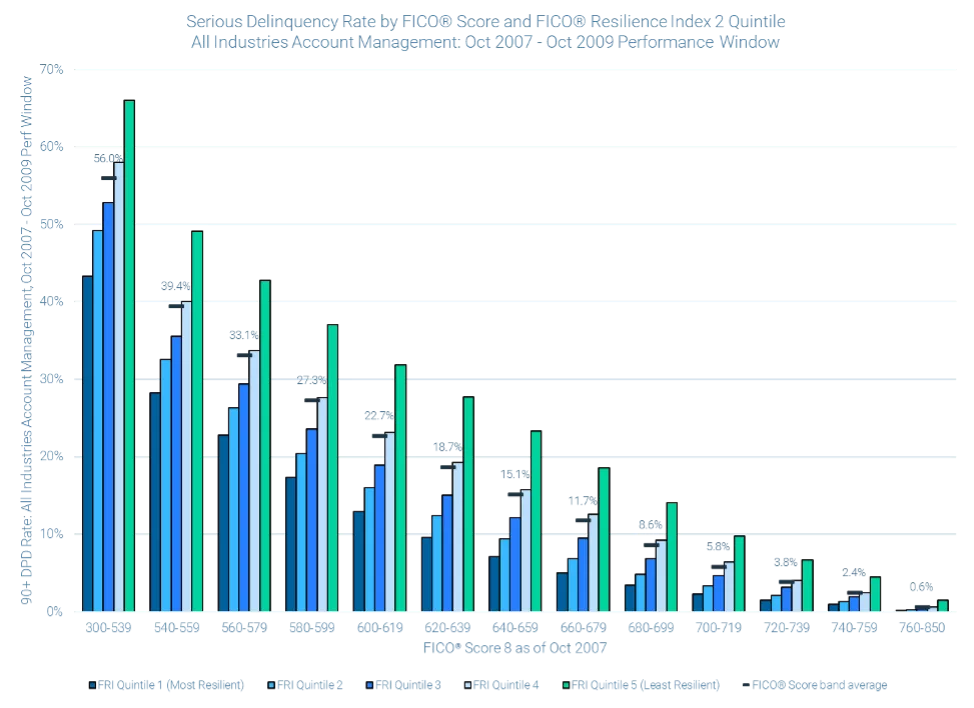
Figure 1: Serious (90+ days past due) delinquency rate by FICO® Score 8 band and FICO® Resilience Index 2 quintile, all industries account management Oct 07-Oct 09. More sensitive borrowers experienced significantly higher default rates during the Great Recession than more resilient borrowers across all FICO® Score bands.
Recent FICO® Resilience Index trends
As seen in Figure 2, both existing and new borrowers became more sensitive overall from 2021 to 2022 but remain below peak 2007 levels. Across all snapshots, existing borrowers were more resilient than new borrowers.
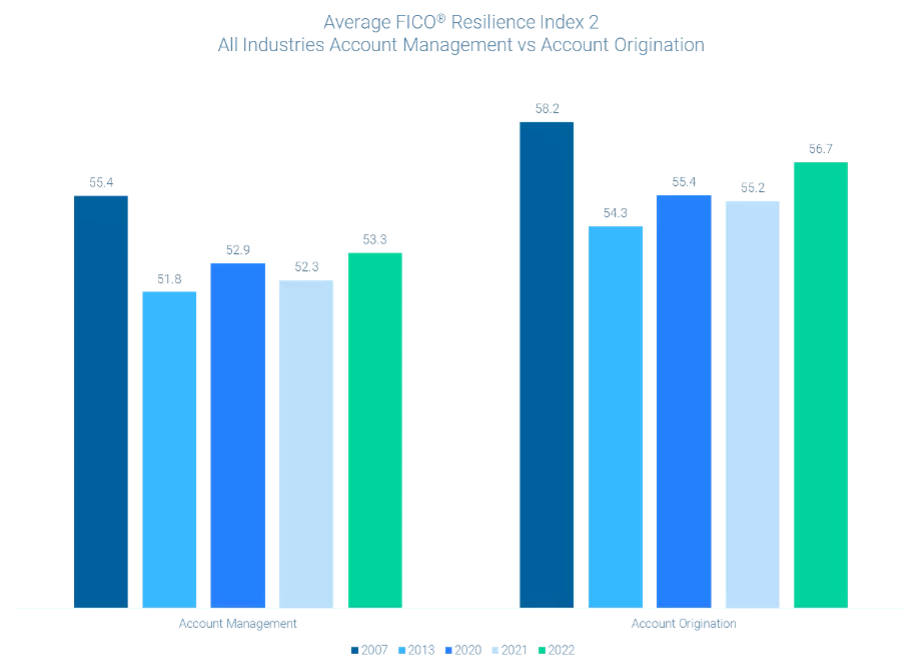
Figure 2: Average FICO® Resilience Index 2 by snapshot, all industries account management vs account origination.
Increases in average FICO® Resilience Index values over time correspond well to changes in the percent of borrowers in the Sensitive (60-69) or Very Sensitive (70-99) segments, as seen in Figure 3.
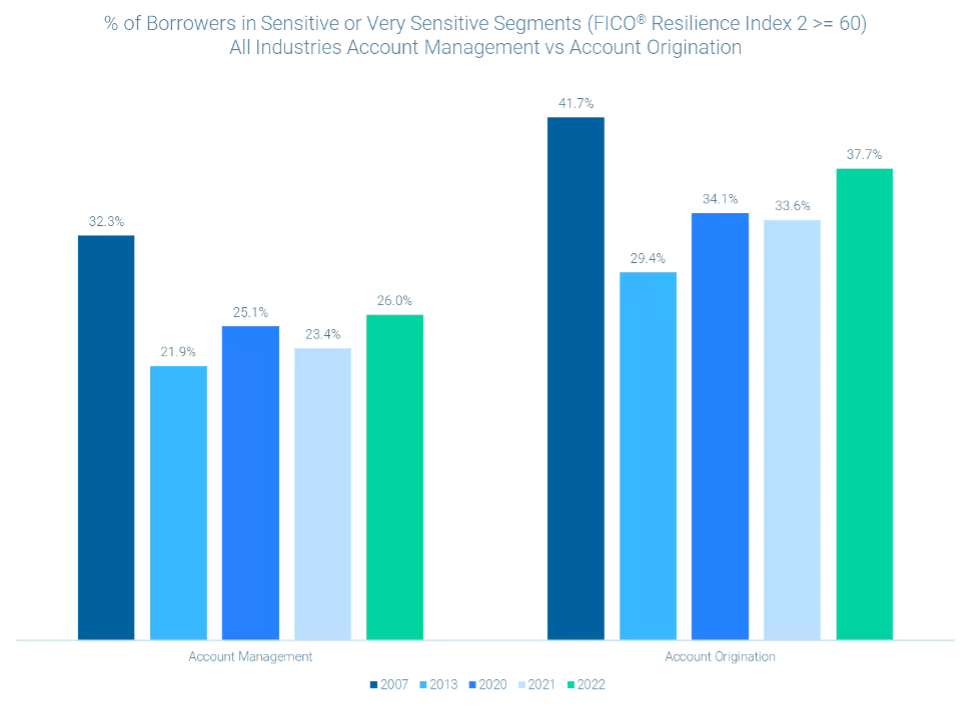
Figure 3: Percent of borrowers with FICO® Resilience Index 2 values in the Sensitive (60-69) or Very Sensitive (70-99) segments by snapshot, all industries account management (Apr 2022 score date) vs account origination (Jan 2022).
FICO® Resilience Index trends by FICO® Score band
Although FICO® Resilience Index is overall not well-correlated to FICO® Score, high FICO® Score borrowers (760-850) are consistently more resilient than lower-scoring borrowers. Interestingly, the borrowers most likely to be considered Sensitive or Very Sensitive had FICO® Scores in the middle of the range rather than at either end. In line with overall patterns, existing accounts were less likely to fall into these more sensitive segments than new accounts across all FICO® Score bands, as shown in Figure 4.
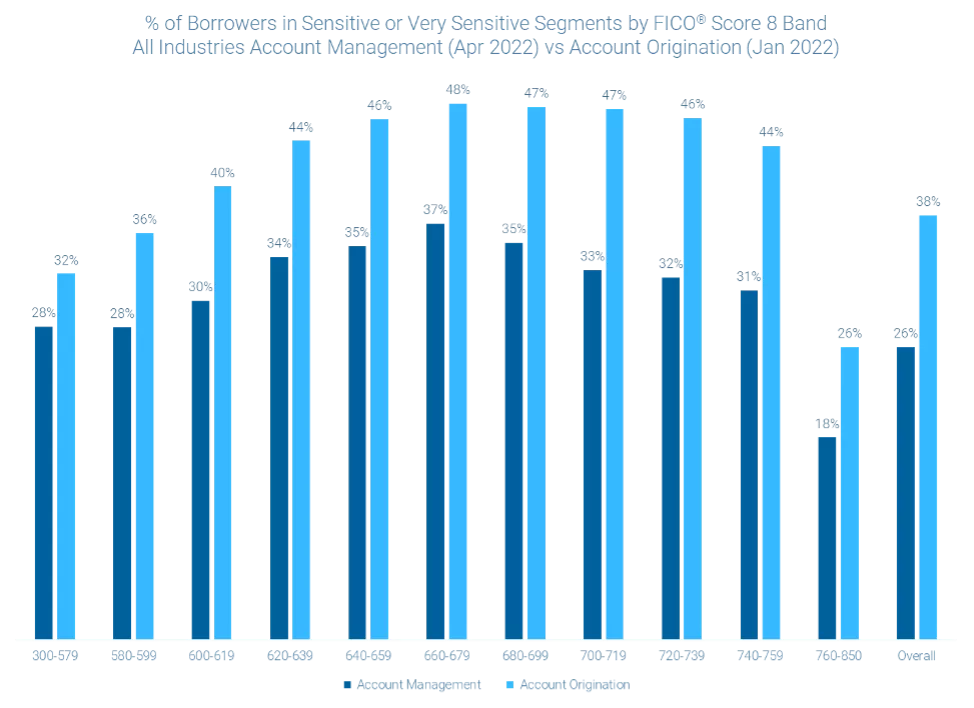
Figure 4: Percent of borrowers with FICO® Resilience Index 2 values in the Sensitive (60-69) or Very Sensitive (70-99) segments by FICO® Score 8 band, all industries account management (Apr 2022 score date) vs account origination (Jan 2022).
Balance-weighted sensitivity comparisons
FICO® Resilience Index is calculated at a consumer-level. Weighting its value by outstanding balance can provide additional insight about how much exposure to credit losses lenders face from their sensitive borrowers. Figure 5 reveals that balance-weighted sensitivity levels were higher than overall sensitivity levels for both new and existing borrowers, reflecting the fact that sensitive borrowers tend to have higher balances than resilient borrowers.
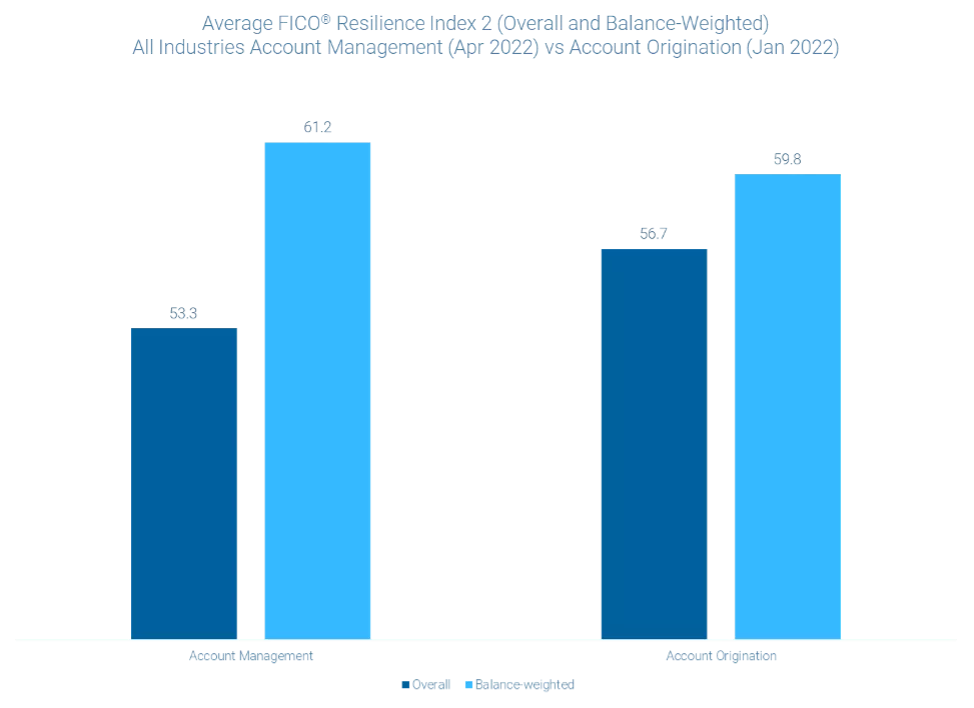
Figure 5: Average FICO® Resilience Index 2, overall and balance-weighted, all industries account management (Apr 2022 score date) vs account origination (Jan 2022).
FICO® Resilience Index distribution impact simulation
To put differences in overall resilience levels in context, the following simulation examines a “what if?” scenario that assumes borrowers were more resilient at the start of the Great Recession than they were. Specifically, we simulated credit risk performance from October 2007 to October 2009 across four key industries (mortgage, bankcard, unsecured personal installment lending, and auto finance) assuming FICO® Resilience Index distributions by FICO® Score band as of October 2013. No change was assumed to FICO® Score distributions as of October 2007 so that the benefit of greater resilience could be isolated. Observed industry-specific default rates were calculated and applied by FICO Score band and FICO Resilience Index segment.
Based on this simulation, Figure 6 highlights potential reductions in 90+ days past due default rates ranging from 7% to 22%, providing strong evidence that greater borrower resilience entering the Great Recession may have mitigated its severity across all key industries.
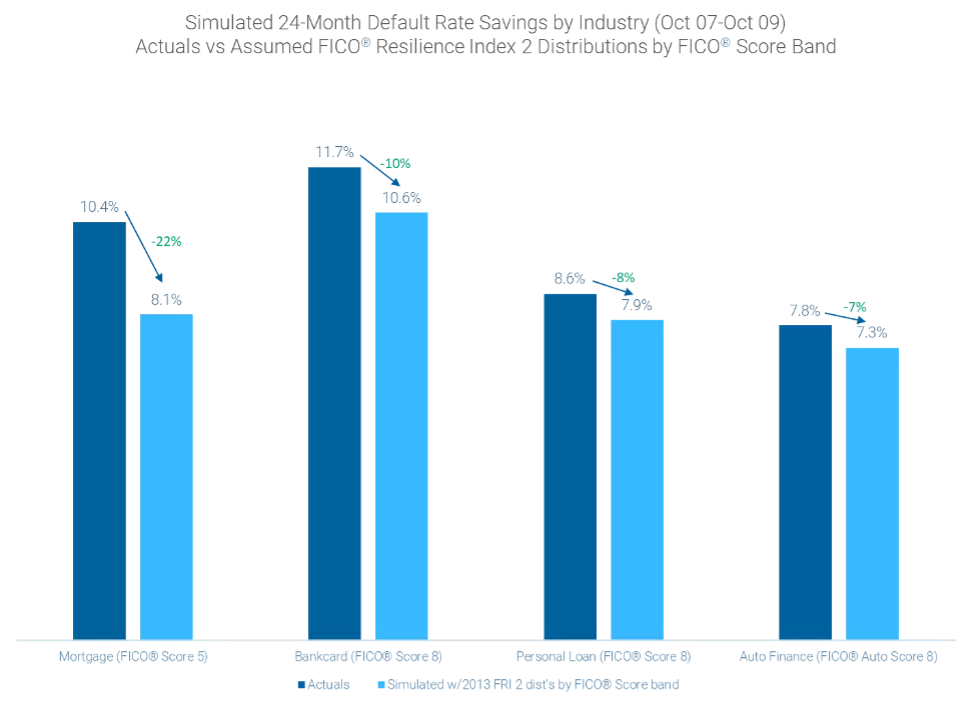
Figure 6: Simulated default rates by industry, comparing actual 2007-9 performance to simulated performance assuming industry-specific FICO® Resilience Index 2 distributions by FICO® Score band as of Oct 2013.
Please visit the FICO Blog to keep up to date on all of FICO’s latest insights and offerings, including our recent post summarizing average FICO® Score benchmarks and drivers across the United States.
To gain more background about the FICO® Resilience Index, or to access the full set of benchmarking reports on which this analysis has been based, please visit https://www.fico.com/en/products/fico-resilience-index or contact ScoreSupport@fico.com.

Popular Posts

Has the Reporting of Rental Data to the Credit Reporting Agencies (CRAs) Increased?
FICO Score 10T includes rental data, but consumers can only experience the benefit of this to the extent that their rental data is reported to the CRAs
Read more
Average U.S. FICO® Score at 716, Indicating Improvement in Consumer Credit Behaviors Despite Pandemic
The FICO Score is a broad-based, independent standard measure of credit risk
Read more
FICO Statement on FHFA and FHA Updates to Credit Score Modernization
FICO supports FHFA’s announcement that the long-anticipated historical data for FICO® Score 10T will be released to the mortgage market.
Read moreTake the next step
Connect with FICO for answers to all your product and solution questions. Interested in becoming a business partner? Contact us to learn more. We look forward to hearing from you.