FICO Safe Driving Score Measures Driver Risk
What are the top characteristics that help drivers achieve a good FICO® Safe Driving Score?

Traffic collisions result in over 1.3 million fatalities globally every year and leave tens of millions with non-fatal injuries. National Highway Traffic Safety Administration projects an estimated 42,915 fatalities in traffic collisions last year in the US alone, a 10.5% increase from the 38,824 fatalities in 2020 --- the largest annual percentage increase in the Fatality Analysis Reporting System’s history.
To help make roads safer, FICO launched the FICO® Safe Driving Score in 2016 in partnership with eDriving, a Solera company and global risk management leader emphasizing proper education and reinforcement of safe driving behaviors. Global industry leaders with fleets employing tens of thousands of drivers in service, delivery, and sales sectors, have been using the FICO Safe Driving Score as a proven driver risk predictor in their Fleet Safety Management programs with great success.
By coaching their drivers towards higher FICO® Safe Driving Scores, these companies can derive additional benefits beyond reducing collisions, incidents, and injuries, including fuel savings --- a crucial component in managing vehicle and fleet ownership costs given the recent spike in gas prices.
The FICO® Safe Driving Score leverages telematics-based driving data provided by MentorSM, eDriving’s smartphone app, on an opt-in basis. The score predicts the likelihood of future collisions by evaluating five driving behaviors:
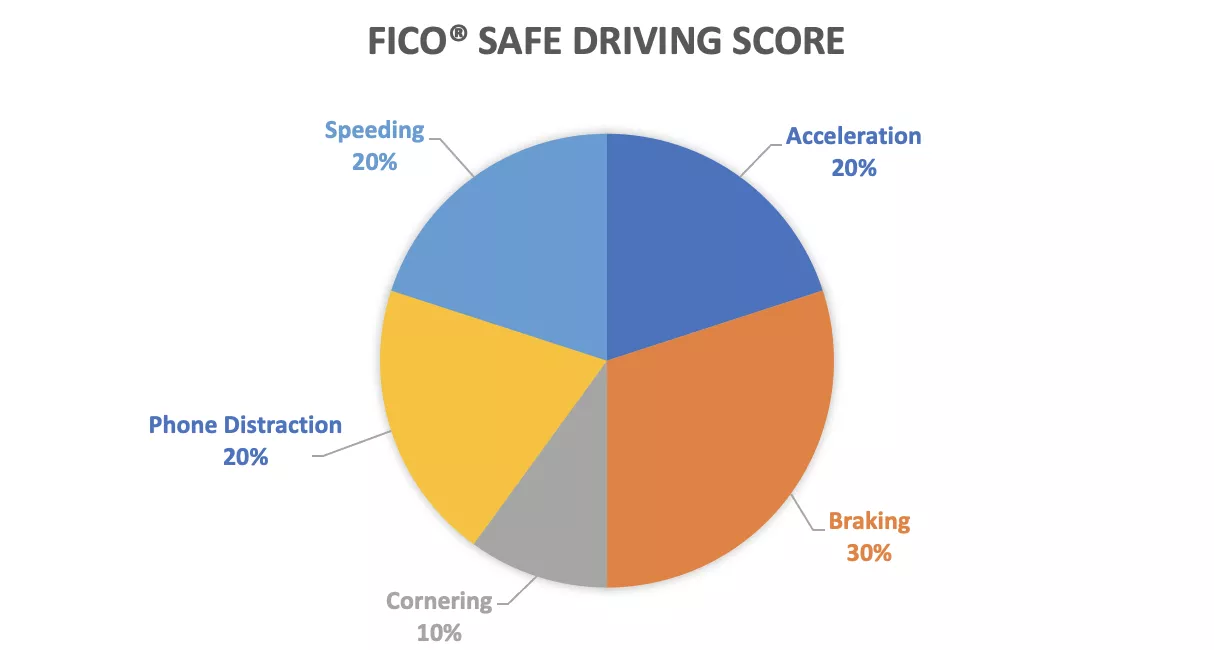
The percentages in the chart reflect the relative importance of each driving behavior to the calculation of the FICO® Safe Driving Score. Through the MentorSM app, the FICO® Safe Driving Score provides a driver’s risk score after each valid trip and over time. The FICO® Safe Driving Score ranges from 100 to 850; the higher the score, the more likely a driver is to display safe driving behaviors and avoid collisions in the future.
Each driving behavior is evaluated across multiple dimensions, such as the frequency and severity of specific events. For example, drivers who consistently brake harshly, accelerate excessively, drive over the speed limit and use their phones while driving present a higher risk of future traffic collisions and will therefore receive a lower score.
To provide a balanced assessment of the driving profile, the FICO® Safe Driving Score considers positive driving behaviors in addition to negative driving behaviors. For example, drivers who avoid harsh braking, excessive acceleration, speeding, and using their phones while driving and consistently demonstrate smooth maneuvers present a lower risk of future traffic collisions and will therefore receive a higher score.
The FICO® Safe Driving Score is also transparent and actionable. Drivers learn the positive and negative driving behaviors impacting their score through receiving feedback factors and can adjust their driving accordingly to improve their score and reduce their risk of future collision.
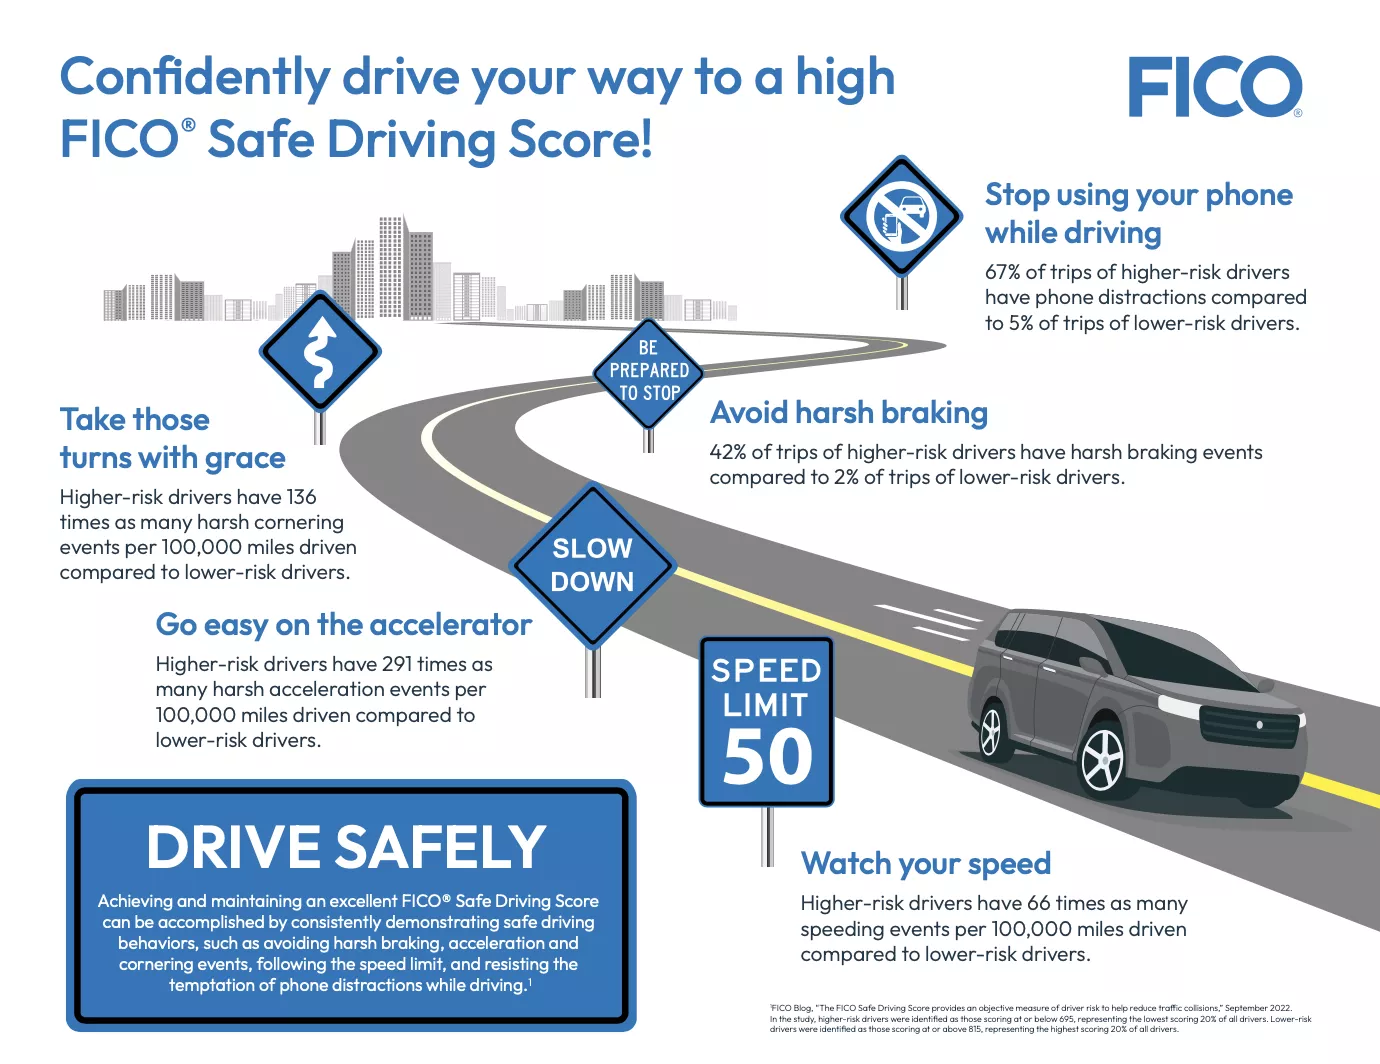
Achieving and maintaining an excellent FICO® Safe Driving Score requires discipline. Drivers who consistently demonstrate safe driving behaviors, such as avoiding harsh braking, acceleration and cornering events, following the speed limit, and resisting the temptation of phone distractions while driving can earn top scores.
So, what do drivers with high FICO® Safe Driving Scores have in common?
FICO conducted a profiling study using a MentorSM data sample representing tens of thousands of Mentor drivers and 5 million miles driven. Here are the top characteristics and habits that have helped these drivers attain and sustain high scores:
- Avoid harsh braking
Given the strong correlation between harsh braking and front-end collisions, it is no surprise that braking accounts for 30% of the FICO® Safe Driving Score. Avoiding harsh braking events and demonstrating smooth stops are crucial for attaining a good score.
Our study showed that 98% of trips of drivers with a FICO® Safe Driving Score of 815 and above have zero evidence of harsh braking; 42% of trips of those with a score of 695 and below have evidence of harsh braking.
The prevalence of harsh braking events between these two groups is quite stark as well: Drivers with a score of 695 and below have on average 1.8 harsh braking events per trip; drivers with a score of 815 and above, on the other hand, have virtually no evidence of harsh braking; on average 0.02 harsh braking events per trip.
Similarly, evidence of positive driving behaviors such as smooth stops varies between these two groups: For drivers with a score of 695 and below, over a third of their trips have no evidence of smooth stops; for drivers with a score of 815 and above, only 13% of their trips have no evidence of smooth stops.
- Go easy on the accelerator
Although harsh acceleration events are not as common as harsh braking events, both their frequency and severity will factor into the calculation of the FICO® Safe Driving Score at 20%. Once again, consistently demonstrating safe driving behaviors by avoiding harsh acceleration is key to attaining a good score.
Most drivers have no evidence of harsh acceleration. However, driving profiles between lower-risk and higher-risk drivers look substantially different when harsh acceleration events are present for both groups: Drivers with a score of 695 and below have 291 times as many harsh acceleration events per 100K miles driven as those drivers with a score of 815 and above. That is, for every harsh acceleration event by a driver with a score of 815 and above, almost 300 harsh acceleration events are observed for a driver with a score of 695 and below.
- Watch your speed
A study conducted by the World Health Organization has found that speeding contributes to around 30% of road traffic fatalities in high-income countries and about 50% in low- and middle-income countries. Given this strong correlation between speeding and severity of collisions, it is no surprise that this category accounts for 20% of the FICO® Safe Driving Score’s calculation. Consistently driving at or below the speed limit is key in avoiding collisions and attaining a good score. One interesting fact from our study is that drivers with a score of 695 and below have 66 times as many speeding events per 100K miles driven as drivers with a score of 815 and above.
- Stop using your phone while driving
Every year, distracted drivers account for around 2.5 million car crashes globally. Talking on the phone or texting while driving are primary examples of distracted driving which lead to collisions, especially among younger drivers. These phone distractions are another key factor accounting for 20% of the FICO® Safe Driving Score’s calculation. Refraining from phone use while driving is the on ramp to a good score.
Our study found that 95% of trips of drivers with a score of 815 and above have zero evidence of phone distractions. In contrast, 67% of trips of those with a score of 695 and below have evidence of phone distractions.
The difference in the frequency of phone distractions between these two groups is eye-catching: Drivers with a score of 695 and below have on average 6 phone distractions per trip; drivers with a score of 815 and above have on average 0.1 phone distractions per trip.
- Take those turns with grace
While harsh cornering events are not very common, their correlation to collisions is still moderate and they contribute to the calculation of the FICO® Safe Driving Score at 10%. Avoiding harsh cornering events and demonstrating smooth turns are essential practices to attain a good score.
Most drivers don’t exhibit harsh cornering events; however, driving behavior between lower-risk and higher-risk drivers looks dramatically different when harsh cornering events are present for both groups: Drivers with a score of 695 and below have 136 times as many harsh cornering events per 100K miles driven as those drivers with a score of 815 and above.
As expected, evidence of positive driving behaviors such as smooth turns varies between these two groups: For drivers with a score of 695 and below, on average, 28% of their turns per trip are smooth; for drivers with a score of 815 and above, on average, 58% of their turns per trip are smooth.
The FICO® Safe Driving Score analyzes these 5 key driving behaviors and provides a consistent and objective measure of driver risk and safety. The score is predictive, transparent, and actionable and can serve as the foundation for a scalable and standardized approach to driver risk management. We are committed to further explore telematics-based driving data, evaluate additional data sources, and innovate even more powerful tools to help keep all drivers safe.

Popular Posts

Has the Reporting of Rental Data to the Credit Reporting Agencies (CRAs) Increased?
FICO Score 10T includes rental data, but consumers can only experience the benefit of this to the extent that their rental data is reported to the CRAs
Read more
FICO Statement on FHFA and FHA Updates to Credit Score Modernization
FICO supports FHFA’s announcement that the long-anticipated historical data for FICO® Score 10T will be released to the mortgage market.
Read more
Average U.S. FICO® Score at 716, Indicating Improvement in Consumer Credit Behaviors Despite Pandemic
The FICO Score is a broad-based, independent standard measure of credit risk
Read moreTake the next step
Connect with FICO for answers to all your product and solution questions. Interested in becoming a business partner? Contact us to learn more. We look forward to hearing from you.