How Can We Reduce the Impact of the Debt Tsunami?
The oncoming flood of delinquent debt is manageable - if you have the capabilities to do it


As noted in my 2021 debt collection predictions, and in previous posts, what we are experiencing is nothing less than a debt tsunami. Just as an actual tsunami is a series of waves caused by the displacement of a large volume of water, a debt tsunami is a series of consumer arrears drivers affecting the credit portfolio of a large body of creditors.
Some of those drivers are routine and some are exceptional. When we look forward to March 2021 we are likely to be impacted by the aggregate of:
- Seasonal post-December peak – high credit utilisation, worry later about how it will get paid
- Uncertain economy – many do not know today what their financial stability will look like next March
- Masking of current and near-term affordability through furloughs and payment holidays
- Masking of employers’ near-term ability to pay salaries through business interruption loans
- Unexpected expense increase from income tax to Brexit (If no deal, estimated >5% cost of living)
- Increased cost of credit – both from payment holidays and need for creditors to cover losses
- Reduced pension incomes – market volatility already showing a 14% swing
The above list is not exhaustive, and we all know that different markets, industries and sectors will have differential return to norm profiles. Some have no profile!
Here's one indicator of "masked" impact:
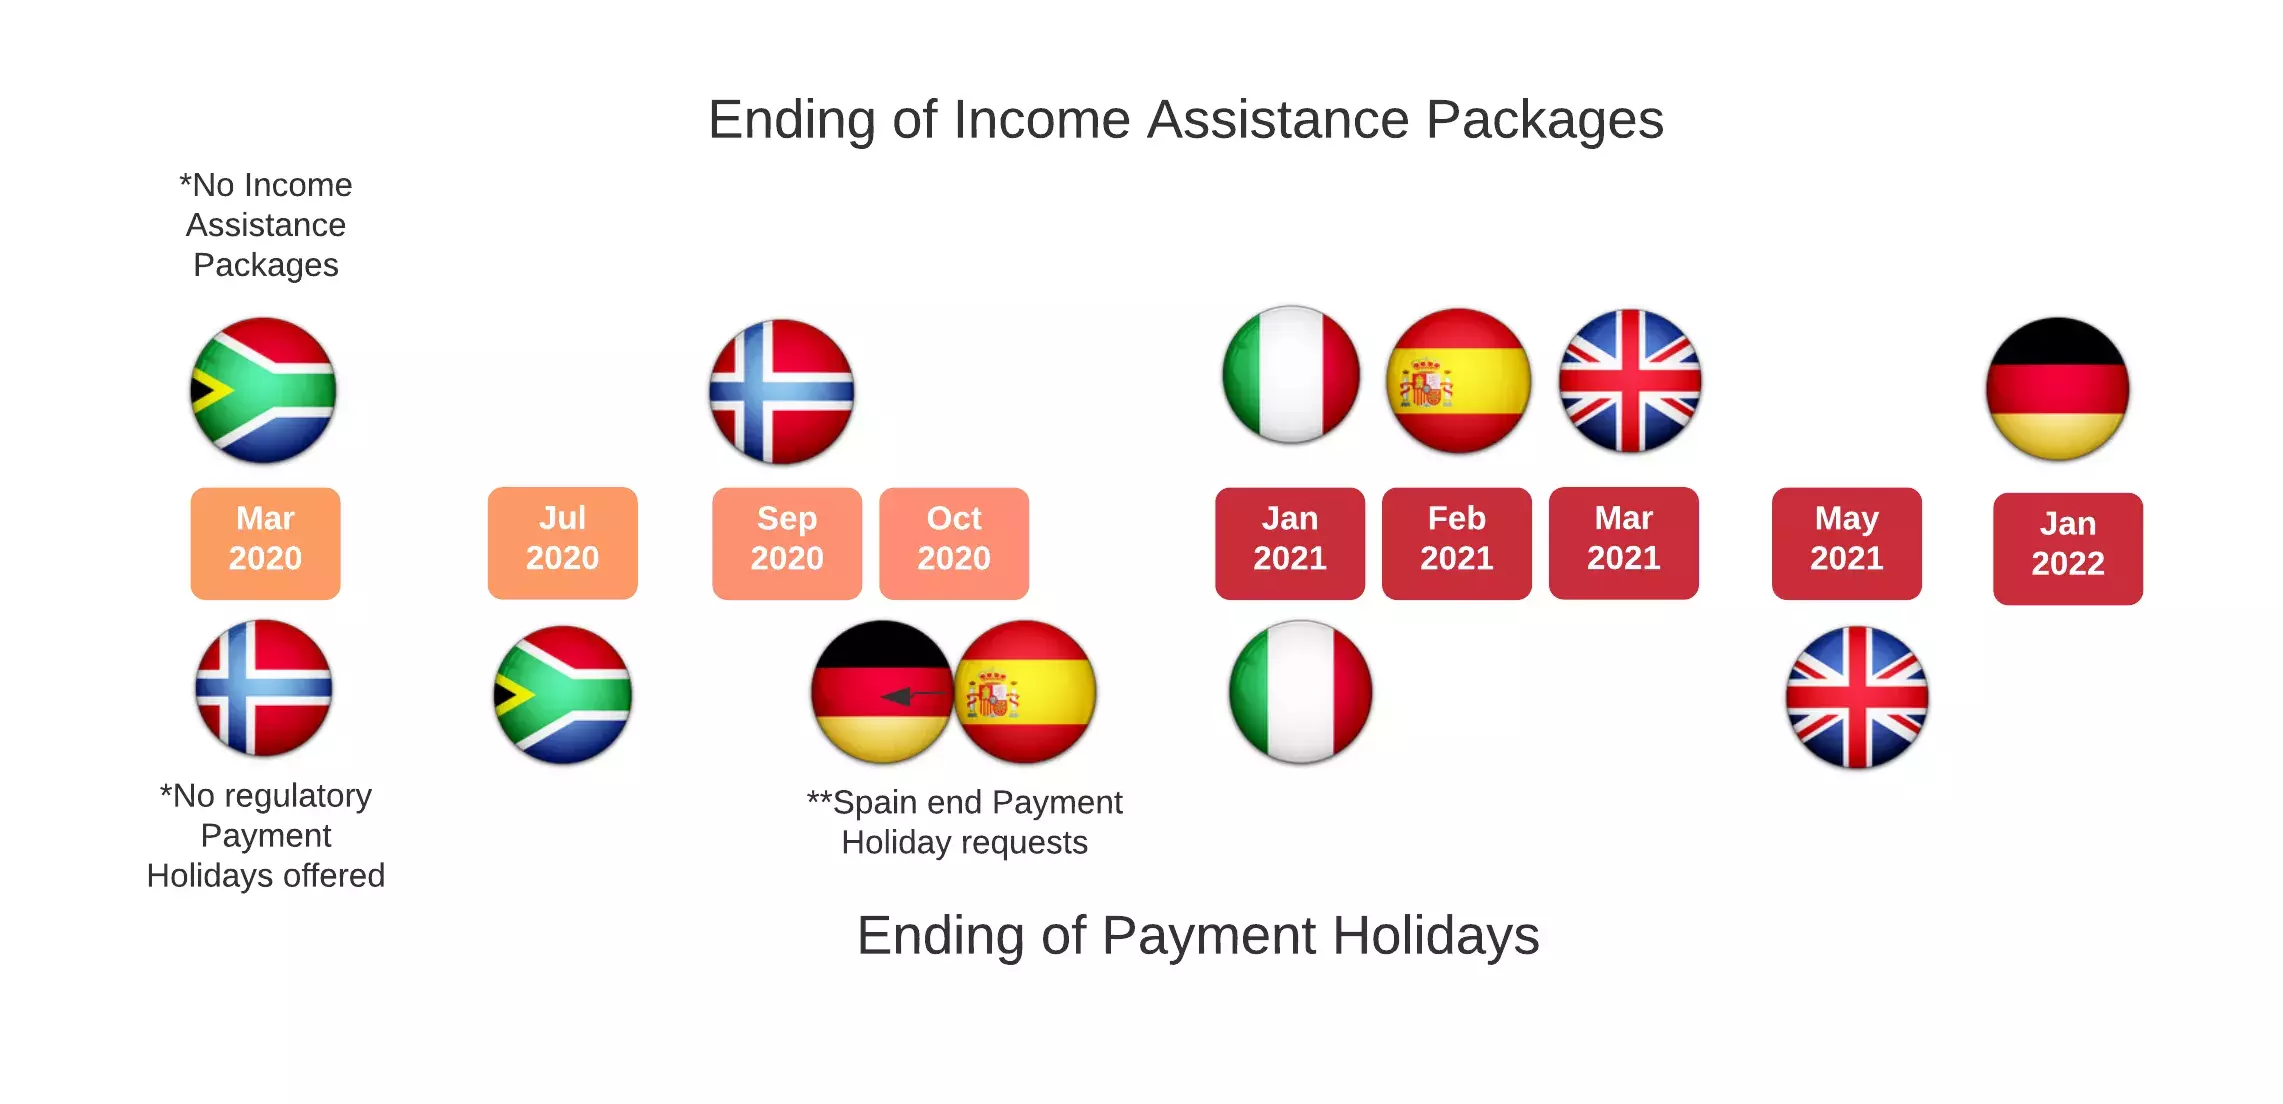
With payment holidays for mortgages or credit ended, in flight or extended across Europe and South Africa, and income assistance packages also coming to an end, the full extent of consumer indebtedness will take time to materialise. Not all borrowers and SMEs will realise the true cost of taking a payment holiday or the extent of payment increase until after the payment holidays have ended.
Halifax, a UK bank, gives the example of someone with a £100,000 repayment mortgage at a rate of 2.75% with a 20-year term remaining. Following a three-month holiday, their monthly payment will rise by £9 – from £542 to £551. Because the balance is remaining higher for three months, the total amount to repay goes up by £485 to £130,605. The average mortgage size for first-time buyers in 2020 is £170,301, which is considerably higher than the example given by Halifax.
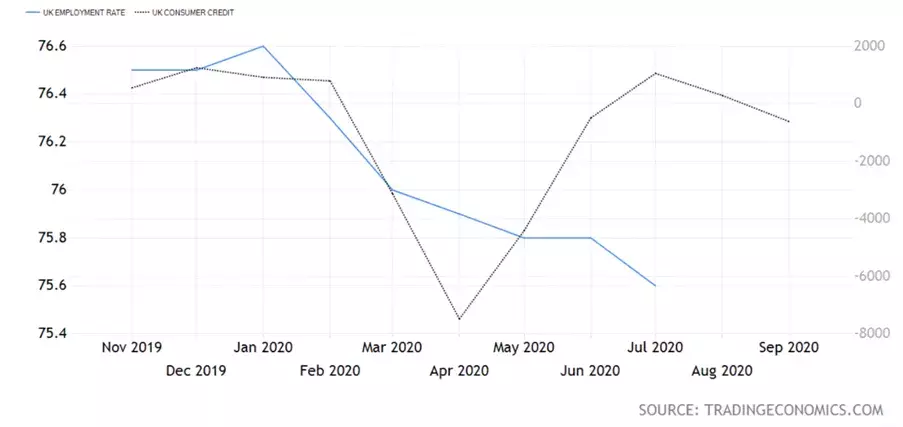
In the UK, with the employment rate falling and consumer lending increasing, debt defaults will see a further rise. We see similar trajectories across the EMEA region. Collections volumes normally rise anyway during this season, due to increased spending over the festive period and company end-of-year restructures that lead to redundancies, both related and unrelated to the pandemic.
FICO have mentioned in recent blogs that a much higher proportion of customers in collections will be good customers in bad circumstances. Those creditors who can’t identify and treat these customers appropriately will increase their credit losses and haemorrhage future good customers.
Now is the time to ensure you truly can deal with customers fairly, with appropriate personalisation, within regulatory guidelines, at scale through automation.
Rate Your Capabilities
These brief questions cover very important capabilities. If you’re not answering Yes, it will most likely mean: collectable arrears are running to loss, cost to collect is not where it could be, customer attrition will be running higher than necessary and you will not be able to boast you have a best practice capability and performance.
- Do you deploy collections-specific scorecards at each cycle 1- 3, with recovery-specific scorecards from 90+?
- Do you deploy propensity models for contact, promise, pay, restructure and litigation?
- Do 65%+ of your cycle 1 customers auto-resolve arrears payment without talking to an agent?
- Can your customer auto-resolve arrears payment anytime 24/7?
- Do you know the probability of take-up and default of the forbearance solution you intend to offer each unique customer?
- Do you know which agency will deliver the strongest yield on each unique customer you place?
- Do you have the capability to validate a customer’s income in real time, online through Open Banking?
- Do you enjoy a 100% automation capability across your collection and recovery ecosystem?
- Do you call on all and any permissively available data, in real time, to influence a customer treatment decision?
At a time when there is a clear spotlight on collections and recoveries, it is vital that personal and businesses customers are treated in line with achieving the best outcome, ensuring good customers can remain customers for the long term, promoting high customer satisfaction and retention. The ability to easily capture data insights using all types of data, such as structured, unstructured, internal or external, allows for more effective customer engagement due to the level of personalisation. Once the personalised data and insights are available, they can be used to enhance and optimise multiple areas. Automation of the right customer treatments and personalised resolution options should be provided to each and every customer based on these insights as well as using affordability validation at that specific time.
To mature many of the capabilities necessary to boast best practice collections and achieve the related performance does not necessitate building the Three Gorges Dam. Many capabilities can be matured on the go, in parallel, tactically with alignment to strategic direction and with low capital investment.
The debt tsunami could not be avoided, but the degree to which the resulting flood gets managed and stays around is very much down to your organization’s ambition to have collections be a core competency and key determinate of profit. It also demonstrates how much your organisation values its good customers in bad circumstances.
Popular Posts

Average U.S. FICO® Score at 716, Indicating Improvement in Consumer Credit Behaviors Despite Pandemic
The FICO Score is a broad-based, independent standard measure of credit risk
Read more
The GSE Data Is Public. Here's What It Shows About Credit Score Modernization.
Independent Milliman analysis of GSE historical data confirms what anyone can now verify directly: FICO® Score 10T is the most predictive score.
Read more
FICO® Score High Achievers: Is Age the Only Factor?
<p>FICO’s latest research on <a href="http://www.fico.com/en/blogs/risk-compliance/us-credit-quality-rising-the-beat-goes-on/" target="_blank">national FICO® Score distribution</a> shows that US credit quality continues to trend upwards, with an increasing number of consumers scoring in the highest scores ranges. Given that, we decided it was time to refresh our study on “<a href="http://www.fico.com/en/blogs/risk-compliance/infographic-what-does-a-high-credit-scorer-look-like/" target="_blank">FICO® Score high achievers</a>,” where we examine the credit behavioural profiles of consumers with higher credit scores.</p> <p>As expected, our latest study showed that older people generally have higher scores, as has been the case in our <a href="http://www.fico.com/en/blogs/risk-compliance/age-before-beauty-credit-worthiness-before-youth/" target="_blank">past research</a>. This is largely because they have trade lines that have been open longer, which leads to higher scores (assuming the trade lines are in good standing and all other things equal). The most credit savvy among you will remember that length of credit history accounts for roughly 15% of the overall <a href="http://www.myfico.com/CreditEducation/WhatsInYourScore.aspx" target="_blank">FICO® Score calculation</a>.</p> <p>But for younger consumers, it isn’t too helpful to say, “just wait until you are 50 years old, and that will fix things!” Thus, I decided to dive deeper with our analysis, including looking at the credit behavioural characteristics of younger consumers with high FICO® Scores.</p> <p>In this analysis, I looked at credit characteristics for the two highest score bands, 750-799 and 800-850, which have about 16% and 23% of the population, respectively. I further broke this down by looking at the characteristics of the youngest 15% in each group, which occurs at age 29 for the 750-799 group and 43 for the 800-850. We used FICO<strong>®</strong> Score 9 for our analysis, and examined typical variables of the categories that go into the make-up of the score.</p> <p><a href="http://www.fico.com/en/blogs/wp-content/uploads/2016/10/FICO-Score-High-Achiever-table.png"><img class="alignnone size-full wp-image-29367" src="http://www.fico.com/en/blogs/wp-content/uploads/2016/10/FICO-Score-High-Achiever-table.png" alt="fico-score-high-achiever-table" width="715" height="747" /></a></p> <p>Since there’s a lot to dissect in this chart, I’ll highlight a few findings that struck me: <ul> <li><strong>Credit history.</strong> Higher scores are undoubtedly associated with a longer time on file. What’s striking is the higher average time on file for the 800+ group, both overall and for revolving accounts (the most common trade line). Clearly, it helps to start credit use early in life – but that’s not the sole determining factor for high scoring. The younger cohorts in both the 800+ and 750-799 groups have time on file medians significantly less than their older counterparts.</li> <li><strong>New credit.</strong> High credit scorers do, in fact, pursue new credit. We see little variation in months since last trade line opening and last inquiry among all groups observed.</li> <li><strong>Pay on time.</strong> As you might expect, the further in the past the delinquency, the higher the score – and that’s <u>if</u> a delinquency ever happened. 95% of the 800+ people and 72% of the 750-799 group have never been delinquent, which is a striking contrast to the 57% for the total population. The percentages for the younger groups are even higher, especially so for the 750-799ers. Collection items are also scarce for these high scorers. While 23% of the national population have collection items greater than $99, the figures are only 0.5% for the 800+ group and 3% for the 750-799 group. It is clear that, in conjunction with starting a credit file early, paying on time is a key trait of the FICO® Score high achiever.</li> <li><strong>Balance and utilization.</strong> Finally, we look at how credit is being used, focusing on revolving product use. (Since most people only have one mortgage or one auto loan, variation in instalment product figures is minimal and driven by payment history, which is near perfect for high scorers, as we’ve seen.) FICO® Score high achievers tend to have more open revolving accounts. While the % active trades and utilization are generally lower, by no means do high scorers avoid the use of credit products. What drives the difference here is the amount of <u>available</u> revolving credit utilized. The 800+ group is roughly 1/4 of the national median, both in total and on their highest utilized card; they also have lower balances and more cards<em>. </em>The 750-799 group is more active and higher utilized, but still only at 2/3 of the national figures. The young 750-799 group compensate with lower revolving balances and, as a result, lower utilization, which is in line with what we see for the 800+ group.</li> <li><strong>Benchmarks.</strong> I’d like to point out that while this study provides good benchmarks of the typical credit traits of the FICO® Score high achiever, individual credit profiles will vary widely. And keep in mind that when we sort groups of consumers as a whole by different behaviours, some results may look superficially odd. For example, the 800+ band has a longer median average open account time (128 months) than average revolving months on file (140 months).</li> </ul> So, what do we conclude? A huge takeaway is that high scorers don’t have too much in the way of serious delinquencies and negative public record data.</p> <p>In most respects, the young 800+ people are like their peer group. They really only differ markedly in their shorter credit history and higher non-mortgage balance, both of which are a function of life stage. Our results show that you don’t have to be a credit product hermit; these high scorers have more credit cards. The takeaway is to start credit activity early and maintain well-managed and moderate usage.</p> <p>In many ways, the young 750-799 people are more interesting because their age profile is much younger. Their credit characteristics differ more from their peer group, particularly in terms of length of credit history. They compensate by having almost pristine credit records and lower balances.</p> <p>Ultimately, 39% of US consumers are FICO® Score high achievers, which they accomplish by following common-sense credit practices. It ain’t rocket science!</p>
Read moreTake the next step
Connect with FICO for answers to all your product and solution questions. Interested in becoming a business partner? Contact us to learn more. We look forward to hearing from you.