UK Cards in the Pandemic: New Data on Overlimit Requests
The increase in the amounts being requested and the fact that a higher proportion are being declined could help identify a sub population that is now riskier

FICO has recently carried out a review of UK credit card spending requests for consumers that have either missed payments, already exceeded their agreed limit, or would exceed their limit if the transaction was approved. Our aim was to gauge the impact of the pandemic and how policies have changed since our last review several years ago. (Most card transactions in the UK, approximately 99%, are made by card users spending within their limit and have no missed payments.
Typically, issuers are trying to walk a fine line between customer service (the embarrassment of being declined in store or online can damage the relationship), keeping losses to a minimum and being a responsible lender by trying to ensure that any extra spend is affordable to their customer.
February 2020 and 2021 results were compared to understand whether the pandemic has had any impact on requests and how they were managed. Here's what we found:
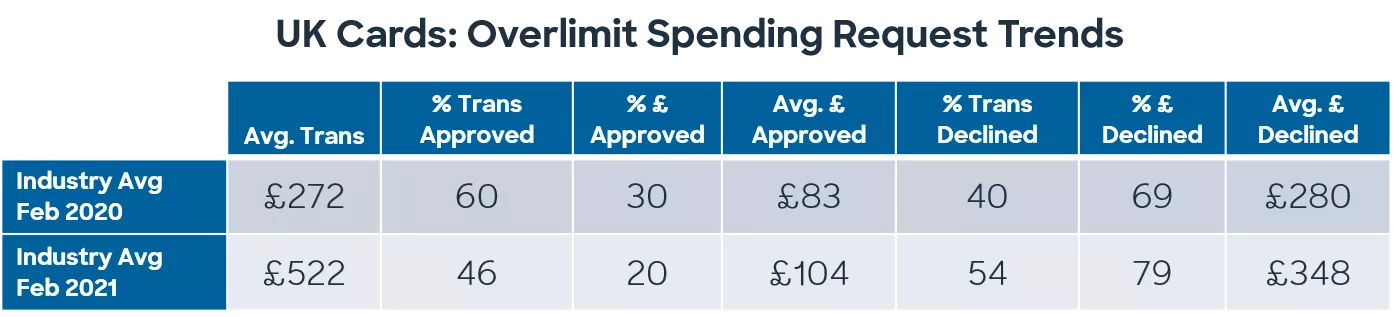
- The number and value of transactions has decreased over the year in the Industry. This can be related to a combination of higher savings for some (and so fewer card users trying to go over their card limit), lower spend and the government financial support providing consumers with the funds to maintain their payments.
- The average transaction value has increased year on year by 92% or £250.
- The industry has seen a drop in the percentage of transactions being approved, 24% lower than a year ago.
- The percentage of the value approved is even lower YOY, at 52%.
- The average approved transaction amount, however, has increased by 35% to £104.
- The average declined transaction has risen to £348 or by 2%.
These results are reflected in the decrease we have seen in our risk benchmarking data for the percentage of accounts exceeding their limit, as well as the fact that those that do go above limit, do so with a higher amount.
The increase in the amounts being requested and the fact that a higher proportion are being declined could help identify a sub population that is now riskier, whether due to the pandemic or not. This could be a result of an increased reliance on the credit card for everyday spend, dwindling savings or the fact that limit increase programmes were put on hold for several months and have only gradually been reintroduced with some rendering eligibility more difficult.
Whilst there are no regulations that directly impact this type of decisioning, we have seen the following being incorporated into the approve or decline decision process over the last couple of years. As the decision to approve or decline must be made in milliseconds, issuers keep the amount of data used to determine the outcome to a minimum so as not to delay the response.
- More bureau and customer level data – We have seen an increase in the amount of bureau and customer-level data elements used to make the approve/decline decision. Bureau data supplies issuers with a wider customer view and highlights signs of financial stress at other lenders. This data is used to determine the risk level of the customer, based on, for example on, payments on any product, time since a negative event or on a bureau/customer score. Customer-level data will provide insight into total exposure and balances on all products and can be specific to one lender or across all financial holdings linked to that customer, which is the preferred approach. Use of this data means issuers can help prevent extra spend on those experiencing debt problems.
- Expansion of affordability metrics – Affordability metrics are mainly used within the credit card limit increase process to determine whether a customer can support the extra credit. Over the last few years, a subset of that data has started to be utilised in this decision process to determine if the extra spend is sustainable, whether it’s within the credit limit for accounts with missed payment or above the existing limit. Typically, this will involve looking at the indebtedness of the customer either within the specific financial institution or across all their financial holdings at all lenders. Examples include setting a total exposure cutoff; the best-in-class approach is to review the debt-to-income ratio if salary data is available.
- An increase in the number of issuers excluding accounts from spending overlimit, or even within limit if payments have been missed, or if the customer has been in persistent debt 12 or more months. This keeps the decision consistent with their exclusion from credit card limit increases.
- Restricted spend if a customer is on a payment holiday as they have stated they need a break from payments so allowing extra spend would add to the debt issues.
There has been a shift in the definition of a young account over the last few years, whereby spend is restricted up to limit, from six months to three. If consumers are trying to spend above limit so soon after the account has been opened, or have already missed payments, it indicates potential issues in other areas. For example, initial limit setting may not be appropriate and a data-driven or optimised approach might be needed. The eligibility thresholds may no longer be in line with the risk appetite and need adjusting or an education communication to remind the customer about fees associated with missing payments or spending above limit and general account management best practices is warranted.)
Since the financial crisis of 2008, we have seen a noticeable reduction in the maximum spend allowed on this subpopulation, particularly for cash spend, with the norm being approved up to limit or any cash decline on accounts missing payments. With higher interest rates and fees for using cash on a credit card, It has always been viewed as higher-risk behaviour. In the current climate, with many uncertainties around consumer finances due to payment holidays and continuing government support, trying to spend above limit could be a sign of serious financial stress.
There is more data than ever available to issuers and it can be difficult to determine which metrics to choose that are the most predictive for your portfolio without lengthy test and monitoring timelines. The pandemic has also shifted consumer behaviour. A cautious approach is recommended for the foreseeable future until the scale of business closures becomes clearer, unemployment rates stabilise or start to reduce, payment holidays are no longer offered and the government supports end, currently planned for the end of September. Issuers may have to respond quickly to changing behaviour as we get further into 2021. We foresee that issuers will turn more to data-driven or optimised strategies to help make their account management decisions. This approach will highlight the most predictive data available to the issuer quicker than traditional analytical methods.
If you have any queries relating to this topic or would like to discuss how you can enhance your card strategies and decisioning, please contact your FICO Advisor or Stacey West via email staceywest@fico.com.

Popular Posts

Average U.S. FICO® Score at 716, Indicating Improvement in Consumer Credit Behaviors Despite Pandemic
The FICO Score is a broad-based, independent standard measure of credit risk
Read more
The GSE Data Is Public. Here's What It Shows About Credit Score Modernization.
Independent Milliman analysis of GSE historical data confirms what anyone can now verify directly: FICO® Score 10T is the most predictive score.
Read more
FICO® Score High Achievers: Is Age the Only Factor?
<p>FICO’s latest research on <a href="http://www.fico.com/en/blogs/risk-compliance/us-credit-quality-rising-the-beat-goes-on/" target="_blank">national FICO® Score distribution</a> shows that US credit quality continues to trend upwards, with an increasing number of consumers scoring in the highest scores ranges. Given that, we decided it was time to refresh our study on “<a href="http://www.fico.com/en/blogs/risk-compliance/infographic-what-does-a-high-credit-scorer-look-like/" target="_blank">FICO® Score high achievers</a>,” where we examine the credit behavioural profiles of consumers with higher credit scores.</p> <p>As expected, our latest study showed that older people generally have higher scores, as has been the case in our <a href="http://www.fico.com/en/blogs/risk-compliance/age-before-beauty-credit-worthiness-before-youth/" target="_blank">past research</a>. This is largely because they have trade lines that have been open longer, which leads to higher scores (assuming the trade lines are in good standing and all other things equal). The most credit savvy among you will remember that length of credit history accounts for roughly 15% of the overall <a href="http://www.myfico.com/CreditEducation/WhatsInYourScore.aspx" target="_blank">FICO® Score calculation</a>.</p> <p>But for younger consumers, it isn’t too helpful to say, “just wait until you are 50 years old, and that will fix things!” Thus, I decided to dive deeper with our analysis, including looking at the credit behavioural characteristics of younger consumers with high FICO® Scores.</p> <p>In this analysis, I looked at credit characteristics for the two highest score bands, 750-799 and 800-850, which have about 16% and 23% of the population, respectively. I further broke this down by looking at the characteristics of the youngest 15% in each group, which occurs at age 29 for the 750-799 group and 43 for the 800-850. We used FICO<strong>®</strong> Score 9 for our analysis, and examined typical variables of the categories that go into the make-up of the score.</p> <p><a href="http://www.fico.com/en/blogs/wp-content/uploads/2016/10/FICO-Score-High-Achiever-table.png"><img class="alignnone size-full wp-image-29367" src="http://www.fico.com/en/blogs/wp-content/uploads/2016/10/FICO-Score-High-Achiever-table.png" alt="fico-score-high-achiever-table" width="715" height="747" /></a></p> <p>Since there’s a lot to dissect in this chart, I’ll highlight a few findings that struck me: <ul> <li><strong>Credit history.</strong> Higher scores are undoubtedly associated with a longer time on file. What’s striking is the higher average time on file for the 800+ group, both overall and for revolving accounts (the most common trade line). Clearly, it helps to start credit use early in life – but that’s not the sole determining factor for high scoring. The younger cohorts in both the 800+ and 750-799 groups have time on file medians significantly less than their older counterparts.</li> <li><strong>New credit.</strong> High credit scorers do, in fact, pursue new credit. We see little variation in months since last trade line opening and last inquiry among all groups observed.</li> <li><strong>Pay on time.</strong> As you might expect, the further in the past the delinquency, the higher the score – and that’s <u>if</u> a delinquency ever happened. 95% of the 800+ people and 72% of the 750-799 group have never been delinquent, which is a striking contrast to the 57% for the total population. The percentages for the younger groups are even higher, especially so for the 750-799ers. Collection items are also scarce for these high scorers. While 23% of the national population have collection items greater than $99, the figures are only 0.5% for the 800+ group and 3% for the 750-799 group. It is clear that, in conjunction with starting a credit file early, paying on time is a key trait of the FICO® Score high achiever.</li> <li><strong>Balance and utilization.</strong> Finally, we look at how credit is being used, focusing on revolving product use. (Since most people only have one mortgage or one auto loan, variation in instalment product figures is minimal and driven by payment history, which is near perfect for high scorers, as we’ve seen.) FICO® Score high achievers tend to have more open revolving accounts. While the % active trades and utilization are generally lower, by no means do high scorers avoid the use of credit products. What drives the difference here is the amount of <u>available</u> revolving credit utilized. The 800+ group is roughly 1/4 of the national median, both in total and on their highest utilized card; they also have lower balances and more cards<em>. </em>The 750-799 group is more active and higher utilized, but still only at 2/3 of the national figures. The young 750-799 group compensate with lower revolving balances and, as a result, lower utilization, which is in line with what we see for the 800+ group.</li> <li><strong>Benchmarks.</strong> I’d like to point out that while this study provides good benchmarks of the typical credit traits of the FICO® Score high achiever, individual credit profiles will vary widely. And keep in mind that when we sort groups of consumers as a whole by different behaviours, some results may look superficially odd. For example, the 800+ band has a longer median average open account time (128 months) than average revolving months on file (140 months).</li> </ul> So, what do we conclude? A huge takeaway is that high scorers don’t have too much in the way of serious delinquencies and negative public record data.</p> <p>In most respects, the young 800+ people are like their peer group. They really only differ markedly in their shorter credit history and higher non-mortgage balance, both of which are a function of life stage. Our results show that you don’t have to be a credit product hermit; these high scorers have more credit cards. The takeaway is to start credit activity early and maintain well-managed and moderate usage.</p> <p>In many ways, the young 750-799 people are more interesting because their age profile is much younger. Their credit characteristics differ more from their peer group, particularly in terms of length of credit history. They compensate by having almost pristine credit records and lower balances.</p> <p>Ultimately, 39% of US consumers are FICO® Score high achievers, which they accomplish by following common-sense credit practices. It ain’t rocket science!</p>
Read moreTake the next step
Connect with FICO for answers to all your product and solution questions. Interested in becoming a business partner? Contact us to learn more. We look forward to hearing from you.