
Display an array in a table
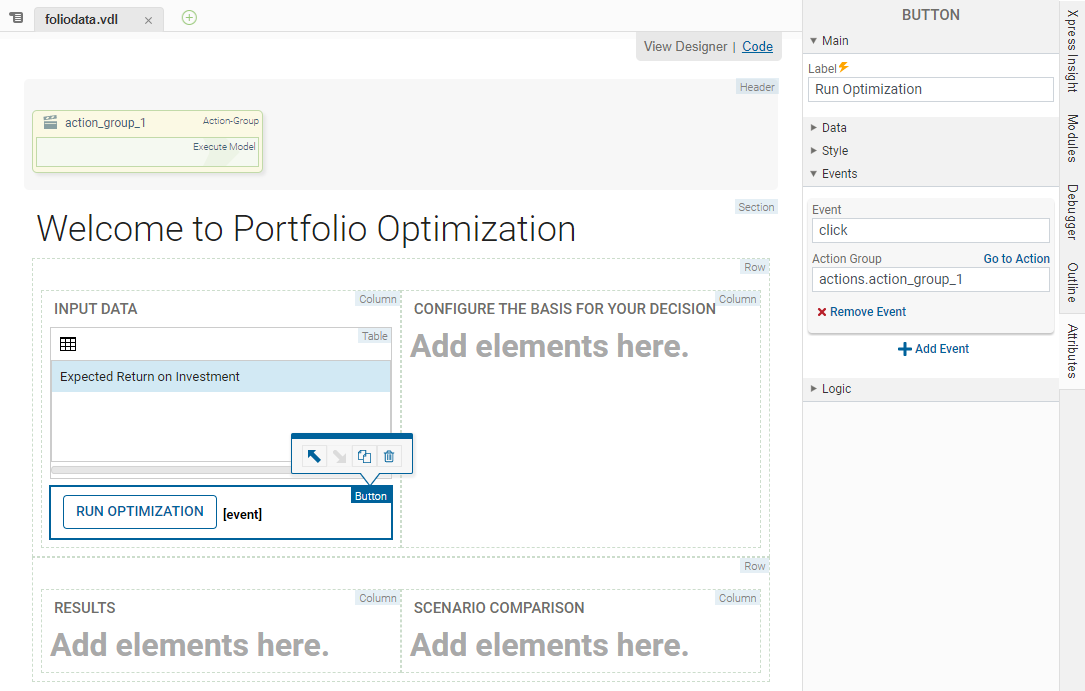
The source file included in the demo folder imports a data file that contains a set of share categories and allocates an estimated return on investment for each. We can create an interface to be able to update this data. To follow best practice, the contents of an array can be displayed in a table.
- In the Palette > Components group, click and drag a Table element onto the INPUT DATA Column. Proceed through each page of the Table wizard before clicking Finish:
- In the first wizard page, select which entities will be used as columns in the table. Select Shares_Return. You can click a selected entity to de-select. Entities are highlighted yellow when selected. Click NEXT.
 Tip The Shares_Return value displays the estimated return on investment calculated in the model.
 - In the CUSTOMIZE window, click the Editable check box for Expected Return on Investment.
- Click FINISH.
- In the first wizard page, select which entities will be used as columns in the table. Select Shares_Return. You can click a selected entity to de-select. Entities are highlighted yellow when selected. Click NEXT.
Column Filtering
Optionally, you can enable column filters by selecting the
Column Filters check box. When the table is published, the column can be filtered using a single range filter per column. The available filter range operators are:
=,
<,
>,
<=,
>=,
!=.

|
Note If column contains text strings, the range operators are treated as part of the search string.
|
© 2001-2020 Fair Isaac Corporation. All rights reserved. This documentation is the property of Fair Isaac Corporation ("FICO"). Receipt or possession of this documentation does not convey rights to disclose, reproduce, make derivative works, use, or allow others to use it except solely for internal evaluation purposes to determine whether to purchase a license to the software described in this documentation, or as otherwise set forth in a written software license agreement between you and FICO (or a FICO affiliate). Use of this documentation and the software described in it must conform strictly to the foregoing permitted uses, and no other use is permitted.