Note: You can see the metrics that a component instance exposes by logging in to DMP Manager and getting the component instance URL from the
Components > Instances page. Paste the URL into your browser and add
/rest/dmp/stats/prometheus. For example:
https://instance-38by05881o.<domain_name>/rest/dmp/stats/prometheus
Decision Modeler Component Metrics
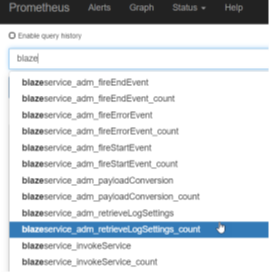
As an example of component metrics, a Decision Modeler component exposes these metrics:
The
*_count metrics are counters that increment the number of times the event occurred. The other values are timers, measured in nanoseconds.