
Decision Tree User Interface
The decision tree user interface consists of a canvas to create and edit the decision tree (known as the Tree View), supported by several other views and interface components.
In the Tree View, you can manually create or edit splits, and create and assign treatments.
The following figure depicts part of a sample loan application decision tree with:
- Two treatments - Decline or Accept
- Six levels, including the start level
- Several splits
- A selected node
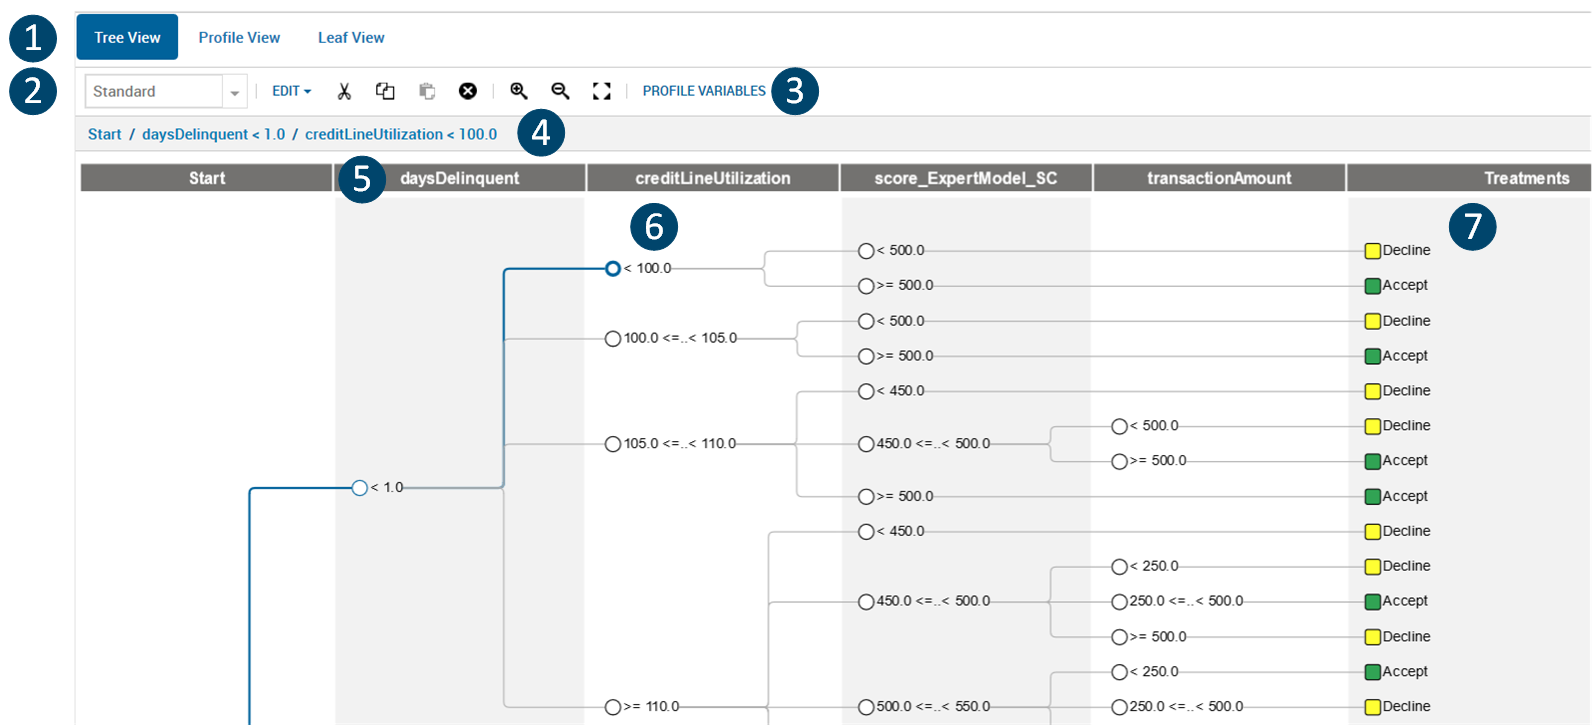
Tree View
The labeled decision tree elements are:
- Decision tree views - Tree View (default), Profile View and Leaf View
Three decision tree views are available:
- Tree View: Edit and refine your tree
- Profile or Leaf views: Profile your variables/decision keys and analyze treatments using leaf node statistics
 Note To use these views, you need to specify which of your decision keys are to be used as profiling variables - this is described later.
- Node view and decision tree toolbar. Different views are available for each node :
- Standard: displays decision node values without statistics (default view)
- Counts: displays decision node values, as well as the total number of counts and the weighted percentage of the total
- Counts-labels: displays decision node values, as well as the total number of counts (#T) and weighted percentage of the total (W%T), with their respective labels
Note Each time you open an existing tree, the Standard view is selected, even if you had selected Counts or Counts-labels in a previous session
The decision tree toolbar contains commands that let you edit, cut, copy, paste or delete decision tree elements. Additionally, you can change the magnification of the decision tree by zooming in, out or to fit the canvas.
- Profile Variables button: with which you can invoke a dialog that enables you to specify the profile variables for the tree.
- Node path: containing a textual representation of the node path to the currently selected element, if any
- Level: each vertical band in the tree is known as a level and corresponds to a variable from the account input data marked as a possible decision key.
- Decision node: a conditional branching point in a decision tree. This node appears as a circle in Standard view or as a rectangle containing statistics in the Counts or Counts-label views.
- Treatments: the rightmost column of a decision tree consists of color-coded treatments that are applied to the end or leaf nodes.