
Counting and Recounting Decision Trees
Tree counting occurs automatically the first time you change the node view to Counts or Counts-labels in the Tree View, or the first time you select the Profile View or Leaf View during the current session of the decision tree.
Counting (... and later, recounting) ensures that statistics are available for the various views.
Once a decision tree is counted initially, all subsequent recounts, in all views, must be performed manually.
Count a tree by changing the node view. Click the drop-down arrow beneath the
Tree View button and choose
Counts or
Counts-labels.
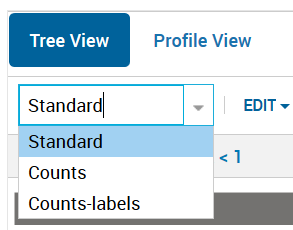
Decision Tree Node View Menu
The node view options include:
- Standard: which displays the condition for each decision node, without counts. Each time you open a tree, the default node view is Standard which does not display counts.
- Counts: which displays the node condition and the total number of counts and weighted percentage of the total for each node.
- Counts-labels: which displays the decision node condition and the total number of counts and their weighted percentage of the total, together with their respective labels - i.e. #T and W%T.
- Click Profile View or Leaf View to view the statistics.

|
Note When you select
Counts or
Counts-labels, the
Proportion and
Recount buttons appear in the decision tree toolbar.
|
If you have not specified which profiling variables you are interested in, you will be prompted to do so when a tree count requires it - just select one or more variables presented from the drop-down list.

|
Important
Xpress Insight only supports the profiling of non-categorical variables (i.e. numeric variables).
|
When you modify your tree - such as editing or inserting splits, merging rows etc, you will need to click Recount to update the count.
Displaying Split Proportions
The
Proportion button appears in the decision tree toolbar when you are viewing the decision tree via
Counts or
Counts-labels. When clicked, the visible decision tree is color-coded to reflect the proportion of input records that pass into a node's split pathways.
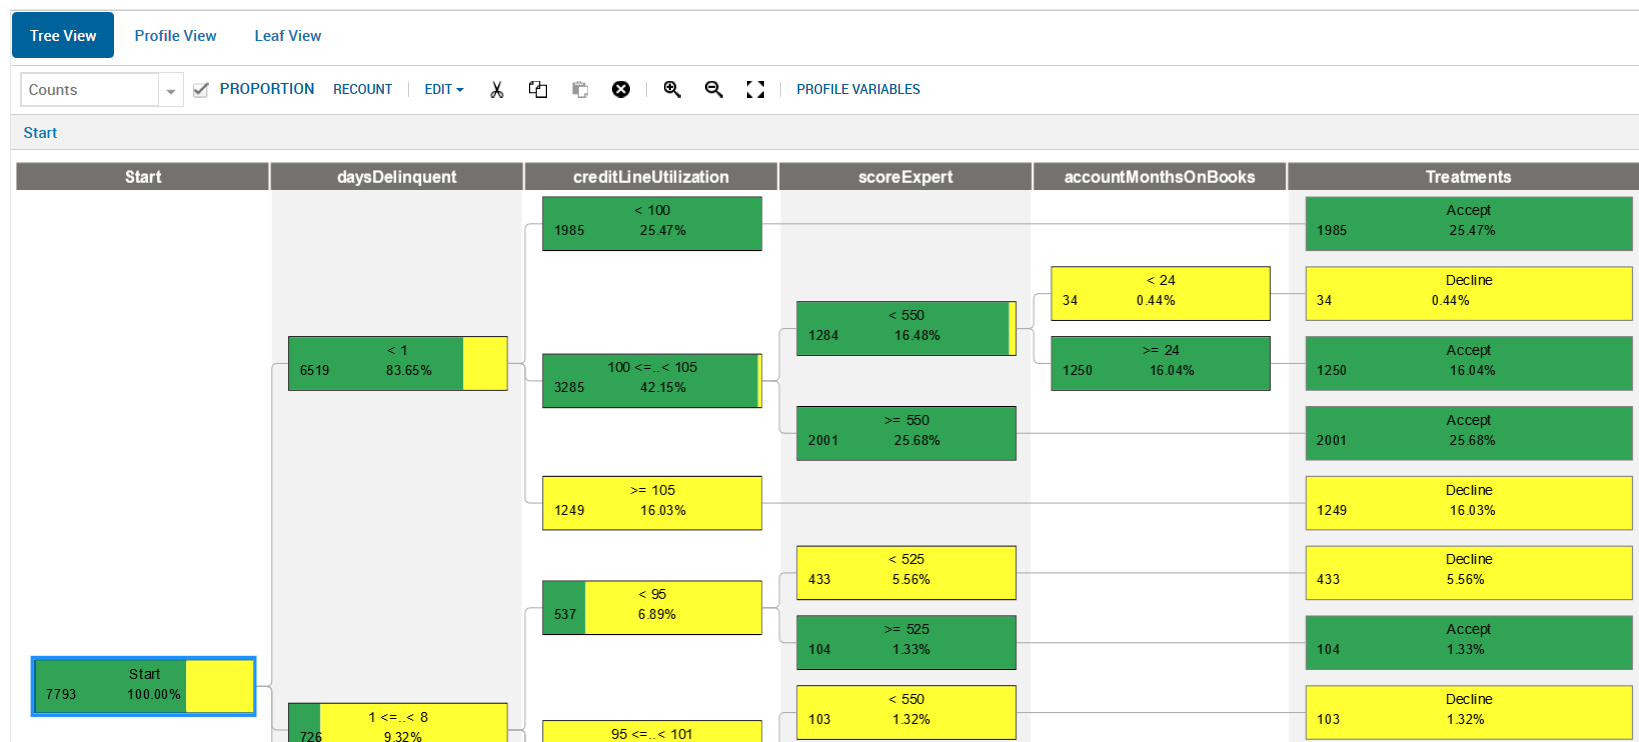
Viewing Split Proportions
This kind of visualization can be very useful in quickly identifying splits that might benefit from additional tuning.