Creating Bar Charts Using Provided Data
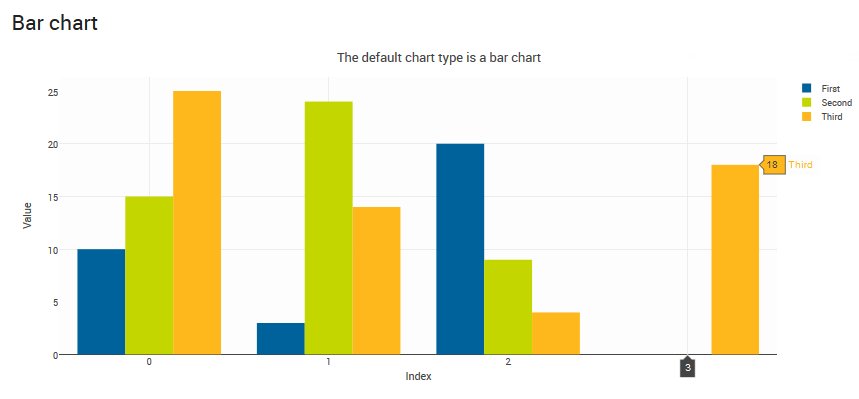
It is straightforward to create a bar chart (the default chart type) using provided static data contained as the data attribute of vdl-chart-series elements
<vdl-chart id="test" title="The default chart type is a bar chart">
  <vdl-chart-axis axis="x" title="Index">
  </vdl-chart-axis>
  <vdl-chart-axis axis="y" title="Value" type="linear">
  </vdl-chart-axis>
  <vdl-chart-series data="=[10,3,20]" labels="First">
  </vdl-chart-series>
  <vdl-chart-series data="=[15,24,9]" labels="Second">
  </vdl-chart-series>
  <vdl-chart-series data="=[25,14,4,18]" labels="Third">
  </vdl-chart-series>
</vdl-chart>
This renders as:


Simple Bar Chart
The significant tags are:
- vdl-chart: The container element for all charts. You can set a title for the chart with the title attribute.
- vdl-chart-axis: Allows you to define x and y axes for your chart via the axis attribute, to give your axes titles via the title attribute and to specify the axis type with the type attribute.
- vdl-chart-series: Use one of these elements for each independent set of data you wish plotted on a chart. In the above example, the data attribute is set to an expression that evaluates to a JavaScript array and the labels attribute designates the labels/legend for the series. The only exception to using multiple vdl-chart-series elements in a chart is with pie charts, where only one such element is permitted.
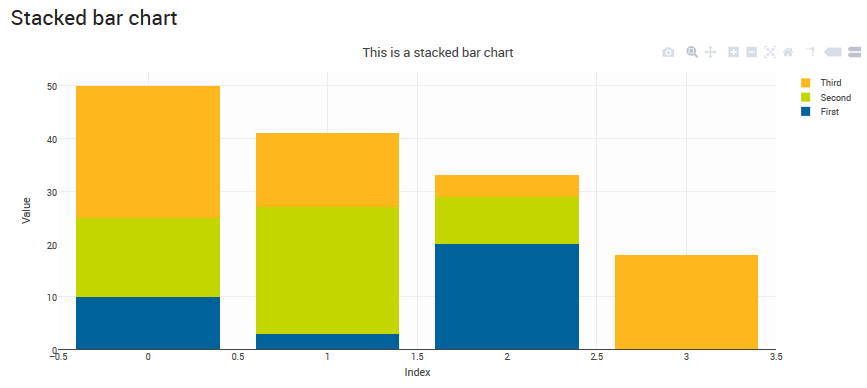
For stacked bar charts, include a
bar-mode=”stack” attribute within the
vdl-chart element:

<vdl-chart bar-mode=”stack” title=”This is a stacked bar chart”>
  …
</vdl-chart>

Stacked Bar Chart

