Creating Line Charts, Scatter Plots and Pie Charts with Provided Data
All of the other chart types can be created from variations of the above examples, noting that the respective vdl-chart-series elements will need a type attribute in anything other than a default bar chart, and that only one vdl-chart-series element is permitted for pie charts.
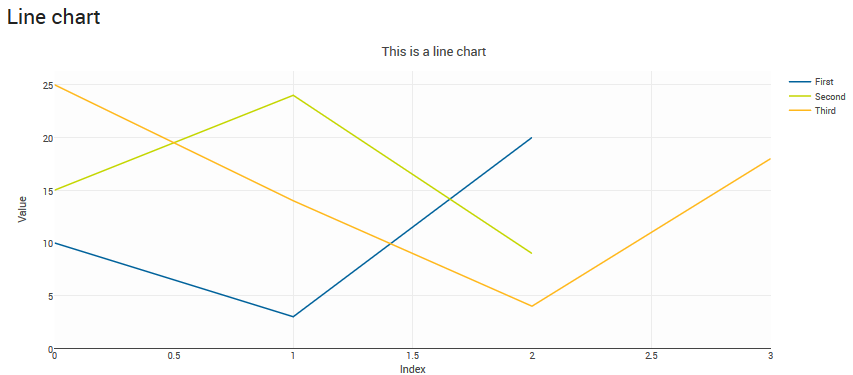
To create a line chart, use:
<vdl-chart title=”This is a line chart”>
  <vdl-chart-axis axis="x" title="Index"></vdl-chart-axis>
  <vdl-chart-axis axis="y" title="Value" type="linear">
  </vdl-chart-axis>
  <vdl-chart-series data="=[10,3,20]" type=”line” labels="First">
  </vdl-chart-series>
  <vdl-chart-series data="=[15,24,9]" type="line" labels="Second">
  </vdl-chart-series>
  <vdl-chart-series data="=[25,14,4,18]" type="line" labels="Third">
  </vdl-chart-series>
</vdl-chart>
Note the
type=”line” attribute on the
vdl-chart-series elements. This renders as:


Line Chart
Use type=”scatter” and type=”pie” for scatter plots and pie charts respectively.
Note that in addition to accepting just one series, pie charts can accept a
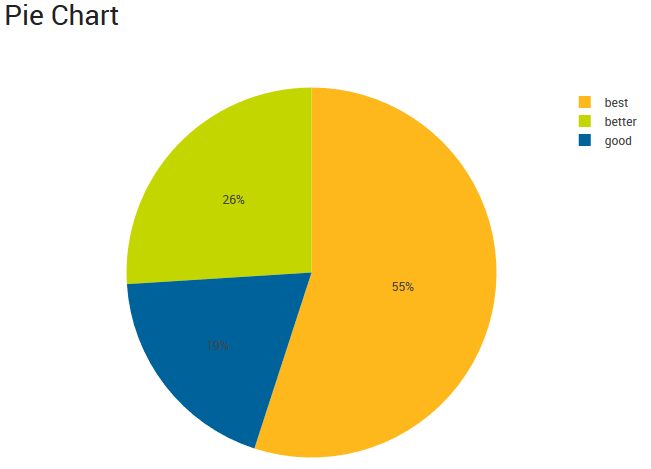
data attribute containing an expression assigning keys and values, whereby the keys become the off-chart legends:
<vdl-chart title=”Pie Chart”>
  <vdl-chart-series data="={keys: ['good', 'better', 'best'],
                    values: [19, 26, 55]}" type="pie" >
  <vdl-chart-series>
</vdl-chart>
Which renders as:


Pie Chart

