
The Matrix tab of the Run Bar
- Sketch view : A summarized view of the rows and columns that make up the matrix
- Column view : A list of all columns in the matrix
- Row view : A list of all rows in the matrix
- Graphical view : An interactive graphical representation of the matrix contents
- Scaling view : A histogram showing matrix coefficient ranges
The Sketch View
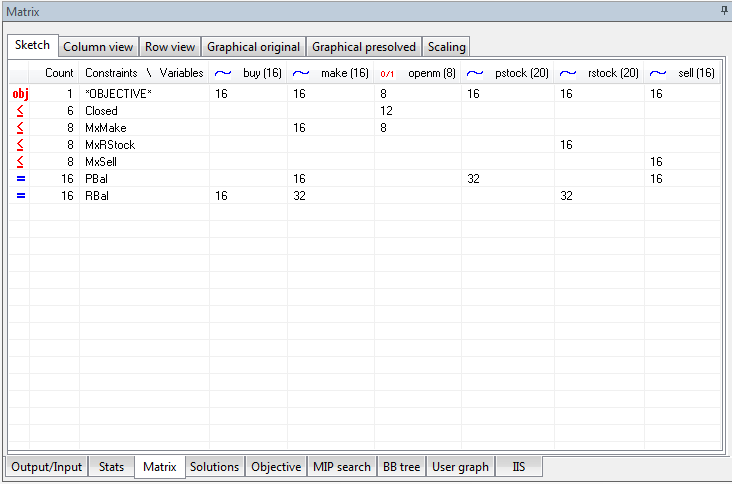
This view attempts to summarize arrays of constraints and arrays of variables into logical units to give a more concise representation of the matrix in the Optimizer.
In the example above, the following information can be gleaned about the matrix from the sketch view:
- There are 6 rows of type = which are named Closed.
- There are 8 rows of type = which are named MxMake.
- There are 8 rows of type = which are named MxRStock.
- There are 8 rows of type = which are named MxSell.
- There are 16 rows of type = which are named PBal.
- There are 16 rows of type = which are named RBal.
- In ALL the 6 = rows named Closed, variables named openm appear 12 times.
- In ALL the 8 = rows named MxMake, variables named make appear 16 times.
- In ALL the 8 = rows named MxMake, variables named openm appear 8 times.
- In ALL the 16 = rows named PBal, variables named make appear 16 times.
- In ALL the 16 = rows named PBal, variables named pstock appear 32 times.
- In ALL the 16 = rows named PBal, variables named sell appear 16 times.
- The objective function references variables named buy 16 times, variables named make 16 times, variables named openm 8 times, ...
- and so on...
Notes:
- Only constraints and variables sent to the Optimizer will be represented.
- In most cases, by examining the names of variables and constraints in the matrix, IVE can determine their 'roots' and implicitly the logical arrays they belong to. Sometimes, however, the intentions of the user may not be guessed correctly. Please keep in mind these actions performed by IVE on each variable and constraint name to determine its root:
- All blanks at the beginning of the name are removed.
- All blanks at the end of the name are removed.
- The name is then searched from left to right for any of these letters: "{[(0123456789". When any such letter is found, that letter and all subsequent letters are thrown away.
- If the previous three steps produce non-empty name, it is the designated as the root of the original name.
- If the previous three steps yield an empty name, start again with the original name and do the following:
- Remove all digits ("0123456789") from the name.
- The remaining letters in the name are designated as the root.
- Some examples:
The root of x[1,2] is x
The root of production_level("Detroit","April",5) is production_level
The Column View
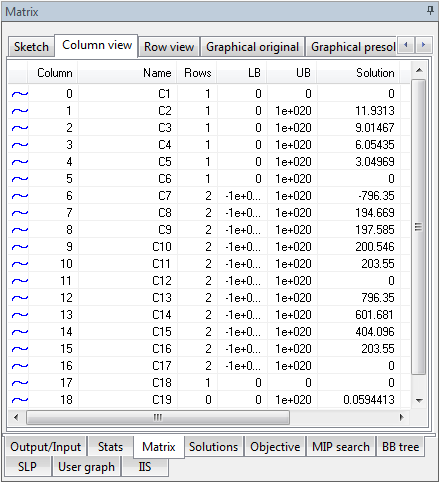
This view lists all variables (columns) in the matrix currently loaded in the Optimizer.
Note:
- Not all variables declared in the model may have been sent to the Optimizer!
- Values are updated as they become available (e.g., if a new integer solution was found, the values are immediately updated).
The headings are:
- An icon showing the type of the variable
- Column: The column number in the matrix for the current variable
- Name: The name of the variable, as understood by Mosel
- Rows: The number of rows(constraints) in which the variable participates
- LB: The lower bound for the variable
- UB: The upper bound for the variable
- Solution: The current solution value of the variable. Check problem status to see if solution is valid!
- Reduced cost: Current reduced cost. See above for validity.
- Type: Description of the type of the variable (continuous, binary, integer, semi-continuous, semi-continuous integer, partial integer)
The Row View
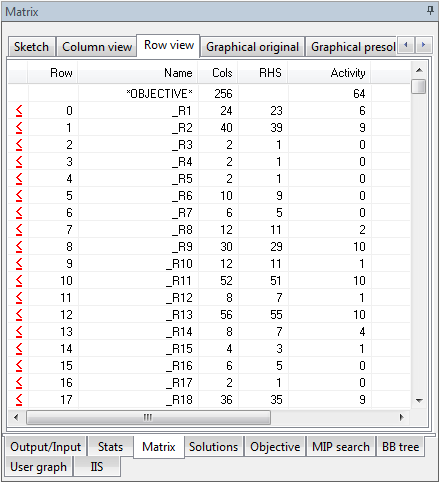
This view lists all constraints (rows) in the matrix currently loaded in the Optimizer.
Note:
- Not all constraints declared in the model may have been sent to the Optimizer: only constraints linked to the Objective function are sent to the Optimizer.
- Values are updated as they become available (e.g., activity values are updated when finding solutions).
The headings are:
- An icon showing the type of the constraint
- Row: The row number in the matrix for the current constraint
- Name: The name of the constraint, as understood by Mosel
- Cols: The number of variables(columns) with nonzero coefficients in this constraint(row)
- RHS: The right hand side of this constraint
- Activity: Its current activity value
- Slack: Its current slack value
- Dual: Its current dual value
- Type: Description of the type of the constraint (=, =,=, range, free)
The Graphical View
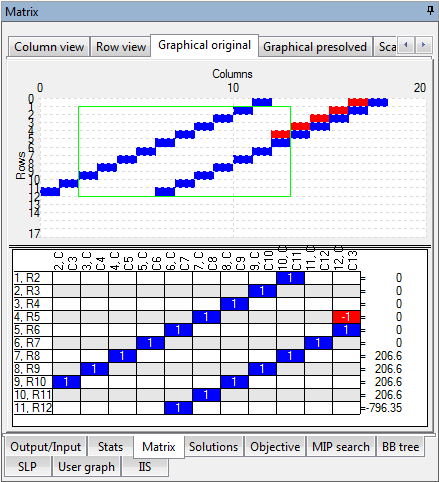
- Use the slider on the left to change the relative size of the two windows.
- If the matrix is small (less than a hundred rows and/or columns), each colored rectangle in the upper part of the window will represent one nonzero coefficient in the matrix.
- If the matrix is large or very large (above one thousand and up to hundreds of thousands of rows and/or columns), a colored rectangle will represent a region in the matrix, corresponding to a certain number of rows and columns. All the nonzero coefficients in the matrix (regardless of its size) are examined; only those regions that have at least one nonzero coefficient will be represented by a colored rectangle.
- The matrix can be zoomed into by clicking and holding the left mouse button and dragging right and down. After zooming, only the region marked by the zooming rectangle will be shown. The coefficients are recounted and the accuracy of the display will increase. After zooming deep in the matrix, a point can be reached where the colored rectangles represent actual coefficients in the matrix. When the current view is the result of a zoom one can move around the matrix by dragging with the right mouse button.
- To zoom out, double-click the left mouse button.
- The rectangle shown permanently next to the cursor acts as a magnifying glass. It marks a region consisting of 12 rows and 10 columns next to the cursor and brings that region into view in the lower part of the window. As the mouse cursor moves around in the matrix, the magnified region is constanly updated.
- The meaning of colors:
- Red — A negative coefficient or a region where all coefficients are negative.
- Blue — A positive coefficient or a region where all coefficients are positive.
- Purple — A region where some coefficients are positive and some coefficients are negative. The shade of purple indicates the predominance of either.
-
In the magnified 12×10 region, the names of the rows (constraints) and columns (variables) are shown (to enable the actual names used in the Mosel model, set the "mmxprs" boolean parameter XPRS_LOADNAMES to true).
At the top, following a comma after each column number is the type of variable:
C — indicates a continuous variable;
I — indicates an integer variables;
B — indicates a binary variable;
S — indicates a semi-continuous variable;
R — indicates a semi-continuous integer variable;
P — indicates a partial integer variable.On the right hand side, the type of constraint is shown. Note that < and > are used instead of the actual ≤ or ≥, to improve readability. In the case of a non-binding constraint, the character '*' is shown.
The Scaling View
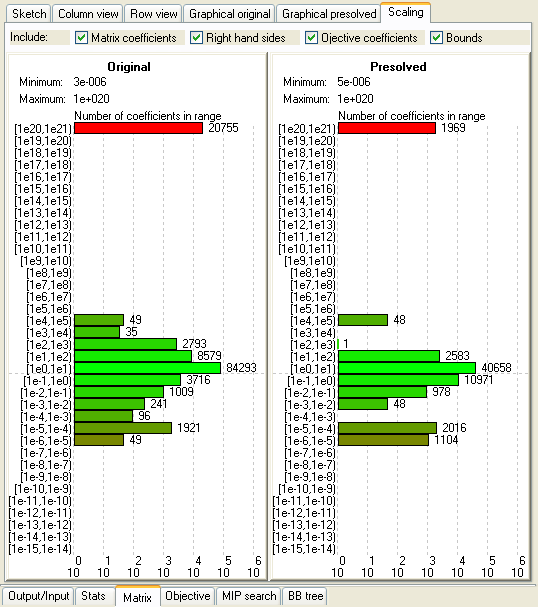
A histogram showing ranges for matrix coefficients, right hand sides, objective coefficients, and bounds.