Graphics and GUIs
Different components of FICO Xpress Optimization provide graphics and GUI functionality for Mosel models:
- Users may enrich their Mosel models with graphical output using the module mmsvg.
- Xpress Insight embeds Mosel models into a multi-user application for deploying optimization models in a distributed client-server architecture. Through the Xpress Insight GUI, business users interact with Mosel models to evaluate different scenarios and model configurations without directly accessing to the model itself.
- XML is a widely used data format, particularly in the context of web-based applications. The Mosel module mmxml provides functionality for generating and handling XML documents. mmxml can also be used to produce HTML format output from Mosel that can be incorporated into Xpress Insight applications.
The functionality of modules mmxml and mmsvg is documented in the Mosel Language Reference Manual. Xpress Insight has several manuals and guides for developers and GUI users, most importantly the 'Xpress Insight Developer Guide' and 'Xpress Insight Web Client User Guide'; the corresponding examples are located in the subdirectory examples/insight of the Xpress distribution.
Drawing user graphs with mmsvg
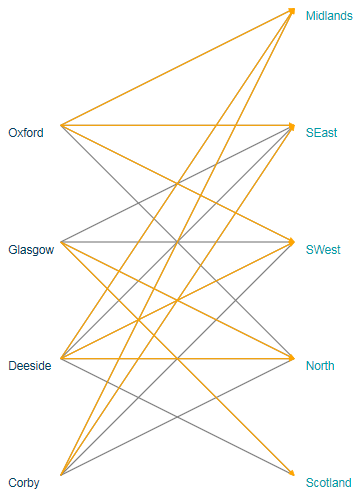
The graphic in Figure User graph for the transport problem is an example of using mmsvg to produce a graphical representation of the solution to the transport problem from Section A transport example.
It was obtained by calling the following procedure draw_solution at the end of the model file (that is, after the call to minimize).
 procedure draw_solution
  declarations
   YP: array(PLANT) of integer           ! y-coordinates of plants
   YR: array(REGION) of integer          ! y-coordinates of sales regions
  end-declarations

  ! Scale the size of the displayed graph
  svgsetgraphviewbox(0,0,4,getsize(REGION)+1)
  svgsetgraphscale(100)

  ! Determine y-coordinates for plants and regions
  ct:= 1+floor((getsize(REGION)-getsize(PLANT))/2)
  forall(p in PLANT, ct as counter) YP(p):= ct

  ct:=1
  forall(r in REGION, ct as counter) YR(r):= ct

  ! Draw the plants
  svgaddgroup("PGr", "Plants", svgcolor(0,63,95))
  forall(p in PLANT) svgaddtext(0.55, YP(p)-0.1, p)

  ! Draw the sales regions
  svgaddgroup("RGr", "Regions", svgcolor(0,157,169))
  forall(r in REGION) svgaddtext(3.1, YR(r)-0.1, r)

  ! Draw all transport routes
  svgaddgroup("TGr", "Routes", SVG_GREY)
  forall(p in PLANT, r in REGION | exists(TRANSCAP(p,r)) )
   svgaddline(1, YP(p), 3, YR(r))

  ! Draw the routes used by the solution
  svgaddgroup("SGr", "Solution", SVG_ORANGE)
  forall(p in PLANT, r in REGION | exists(flow(p,r)) and getsol(flow(p,r)) > 0)
   svgaddarrow(1, YP(p), 3, YR(r))

  ! Save graphic in SVG format
  svgsave("transport.svg")

  ! Display the graphic
  svgrefresh
  svgwaitclose
end-procedure 
Figure 21.1: User graph for the transport problem
XML and HTML
HTML files are simple text files—their contents can be generated as free-format output from Mosel (see for example Section File output). However, more elegantly we can use Mosel's XML module mmxml to generate HTML documents.
mmxml
The module mmxml provides an XML parser and generator for the manipulation of XML documents from Mosel models. An XML document is stored as a list of nodes. mmxml supports the node types 'element', 'text', 'comment', CDATA, 'processing instruction' and DATA (see section mmxml of the Mosel Language Reference Manual for further detail). Each node is characterized by a name and a value. Element nodes have also an ordered list of child nodes. The root node is a special element node with no name, no parent and no successor that includes the entire document as its children.
The type xmldoc represents an XML document stored in the form of a tree. Each node of the tree is identified by a node number (an integer) that is attached to the document (i.e. a node number cannot be shared by different documents and in two different documents the same number represents two different nodes). The root node of the document has number 0. Nodes can be retrieved using a path similar to a directory path used to locate a file (usually called XML path).
Reading and writing XML data
Data for the 'Transport' problem has so far been given as a text data file in initializations format. We now wish to read in the same data from the XML file transprt.xml shown here:
<transport fuelcost="17">
  <demand>
    <region name="Scotland">2840</region>
    <region name="North">2800</region>
    <region name="SWest">2600</region>
    <region name="SEast">2820</region>
    <region name="Midlands">2750</region>
  </demand>
  <plantdata>
    <plant name="Corby">
      <capacity>3000</capacity>
      <cost>1700</cost>
    </plant>
    <plant name="Deeside">
      <capacity>2700</capacity>
      <cost>1600</cost>
    </plant>
    <plant name="Glasgow">
      <capacity>4500</capacity>
      <cost>2000</cost>
    </plant>
    <plant name="Oxford">
      <capacity>4000</capacity>
      <cost>2100</cost>
    </plant>
  </plantdata>
  <routes>
    <route from="Corby" to="North" capacity="1000" distance="400"/>
    <route from="Corby" to="SWest" capacity="1000" distance="400"/>
    <route from="Corby" to="SEast" capacity="1000" distance="300"/>
    <route from="Corby" to="Midlands" capacity="2000" distance="100"/>
    <route from="Deeside" to="Scotland" capacity="1000" distance="500"/>
    <route from="Deeside" to="North" capacity="2000" distance="200"/>
    <route from="Deeside" to="SWest" capacity="1000" distance="200"/>
    <route from="Deeside" to="SEast" capacity="1000" distance="200"/>
    <route from="Deeside" to="Midlands" capacity="300" distance="400"/>
    <route from="Glasgow" to="Scotland" capacity="3000" distance="200"/>
    <route from="Glasgow" to="North" capacity="2000" distance="400"/>
    <route from="Glasgow" to="SWest" capacity="1000" distance="500"/>
    <route from="Glasgow" to="SEast" capacity="200" distance="900"/>
    <route from="Oxford" to="North" capacity="2000" distance="600"/>
    <route from="Oxford" to="SWest" capacity="2000" distance="300"/>
    <route from="Oxford" to="SEast" capacity="2000" distance="200"/>
    <route from="Oxford" to="Midlands" capacity="500" distance="400"/>
  </routes>
</transport>
The Mosel code (file transport_xml.mos) for reading this XML file first loads the entire document (load). We then need to retrieve the nodes we are interested in from the XML document tree structure. This is achieved by selecting lists of nodes that satisfy some specified condition (here: a specific XML path that describes the location of the desired nodes in the document, such as transport/demand/region). XML documents are saved as text, we therefore use functions like getrealvalue or getstrattr to retrieve data and indices of the desired type into the model data structures.
 uses "mmxml"

 declarations
  REGION: set of string                 ! Set of customer regions
  PLANT: set of string                  ! Set of plants

  DEMAND: array(REGION) of real         ! Demand at regions
  PLANTCAP: array(PLANT) of real        ! Production capacity at plants
  PLANTCOST: array(PLANT) of real       ! Unit production cost at plants
  TRANSCAP: dynamic array(PLANT,REGION) of real
                                        ! Capacity on each route plant->region
  DISTANCE: dynamic array(PLANT,REGION) of real
                                        ! Distance of each route plant->region
  FUELCOST: real                        ! Fuel cost per unit distance

  AllData: xmldoc                       ! XML document
  NodeList: list of integer             ! List of XML nodes
 end-declarations

 load(AllData, "transprt.xml")          ! Load the entire XML document

 getnodes(AllData, "transport/demand/region", NodeList)
 forall(l in NodeList)                  ! Read demand data
   DEMAND(getstrattr(AllData,l,"name")):= getrealvalue(AllData, l)

 getnodes(AllData, "transport/plantdata/plant", NodeList)
 forall(l in NodeList) do               ! Read plant data
   PLANTCAP(getstrattr(AllData,l,"name")):=
     getrealvalue(AllData, getnode(AllData,l,"capacity"))
   PLANTCOST(getstrattr(AllData,l,"name")):=
     getrealvalue(AllData, getnode(AllData,l,"cost"))
 end-do
                                        ! Read routes data
 getnodes(AllData, "transport/routes/route", NodeList)
 forall(l in NodeList) do
   DISTANCE(getstrattr(AllData,l,"from"),getstrattr(AllData,l,"to")):=
     getrealattr(AllData,l,"distance")
   TRANSCAP(getstrattr(AllData,l,"from"),getstrattr(AllData,l,"to")):=
     getrealattr(AllData,l,"capacity")
 end-do
                                        ! Read 'fuelcost' attribute
 FUELCOST:= getrealattr(AllData, getnode(AllData, "transport"), "fuelcost")
In the model extract above we have used several simple XML path specifications to retrieve lists of nodes from the XML document. Such queries can take more complicated forms, including tests on node values (all plants with capacity > 3500) or attributes (all routes to 'Scotland')—see the chapter on mmxml in the Mosel Language Reference Manual for further detail.
getnodes(AllData, "transport/plantdata/plant/capacity[number()>3500]/..", NodeList)
getnodes(AllData, "transport/routes/route[@to='Scotland']", NodeList)
We now also want to output the optimization results in XML format. As a first step, we create a root element 'solution' in the XML document ResData. In a well-formed XML document, all elements need to form a tree under the root element. All following nodes (containing the solution information per plant) are therefore created as element nodes under the 'solution' node. The objective function solution value and the execution date of the model are saved as attributes to the 'solution' tag. And finally, we use save to write an XML file or display a node with the (sub)tree formed by its children.
 declarations
  ResData: xmldoc                                  ! XML document
  Sol,Plant,Reg,Total: integer                     ! XML nodes
 end-declarations

 Sol:=addnode(ResData, 0, XML_ELT, "solution")     ! Create root node "solution"
 setattr(ResData, Sol, "Objective", MinCost.sol)   ! Obj. value as attribute
 setattr(ResData, Sol, "RunDate", text(datetime(SYS_NOW)))

 forall(p in PLANT) do
   Plant:=addnode(ResData, Sol, XML_ELT, "plant")  ! Add a node to "solution"
   setattr(ResData, Plant, "name", p)              ! ... with attribute "name"
   forall(r in REGION | flow(p,r).sol>0) do
     Reg:=addnode(ResData, Plant, XML_ELT, "region") ! Add a node to "plant"
     setattr(ResData, Reg, "name", r)              ! ... with attribute "name"
     setvalue(ResData, Reg, flow(p,r).sol)         ! ... and solution value
   end-do
   Total:=addnode(ResData, Plant, "total",
                  sum(r in REGION)flow(p,r).sol)   ! Add node with total flow
 end-do

 save(ResData, "transportres.xml")   ! Save solution to XML format file
 save(ResData, Sol, "")              ! Display XML format solution on screen
The Mosel code printed above will create a file transportres.xml with the following contents:
<?xml version="1.0" encoding="iso-8859-1"?>
<solution Objective="8.1018e+07" RunDate="2012-10-17T14:00:50,664">
  <plant name="Corby">
    <region name="North">80</region>
    <region name="SEast">920</region>
    <region name="Midlands">2000</region>
    <total>3000</total>
  </plant>
  <plant name="Deeside">
    <region name="North">1450</region>
    <region name="SWest">1000</region>
    <region name="Midlands">250</region>
    <total>2700</total>
  </plant>
  <plant name="Glasgow">
    <region name="Scotland">2840</region>
    <region name="North">1270</region>
    <total>4110</total>
  </plant>
  <plant name="Oxford">
    <region name="SWest">1600</region>
    <region name="SEast">1900</region>
    <region name="Midlands">500</region>
    <total>4000</total>
  </plant>
</solution>
Generating HTML
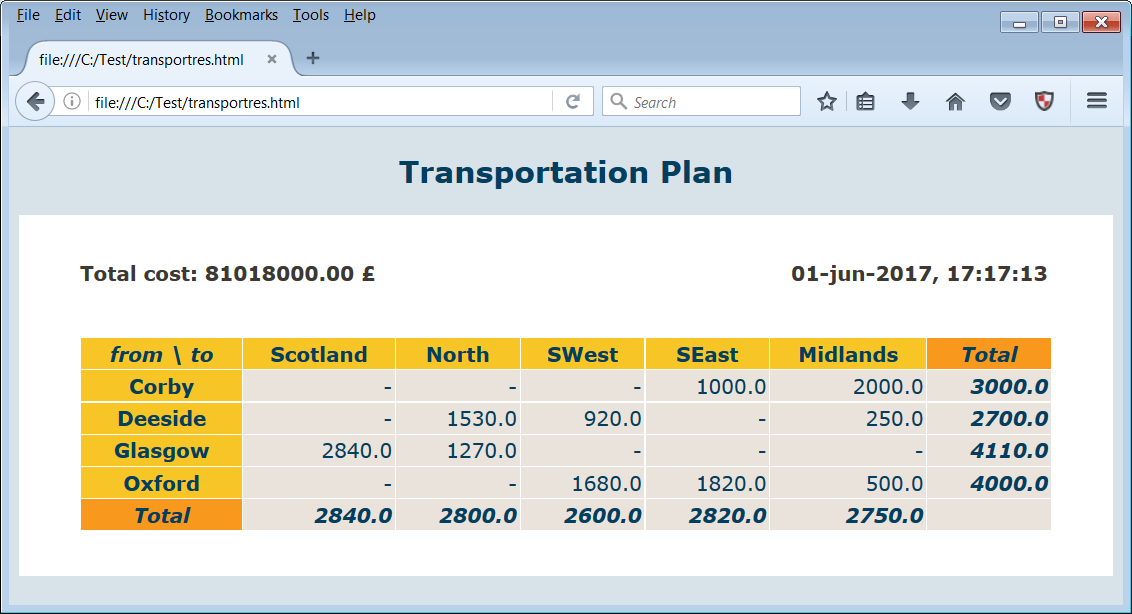
An HTML file is generated and written out just like XML documents. The name of the root element in this case usually is 'html'. Below follows an extract of the code (example file transport_html.mos) that generates the HTML page shown in Figure HTML page generated by Mosel. Notice the use of copynode to insert the same node/subtree at different positions in the XML document. By default, new nodes created with addnode are appended to the end of the node list of the specified parent node. This corresponds to using the value XML_LASTCHILD for the (optional) positioning argument of subroutines creating new nodes.
  declarations
   ResultHTML: xmldoc
   Root, Head, Body, Style, Title, Table, Row, Cell, EmptyCell: integer
  end-declarations

  Root:= addnode(ResultHTML, 0, XML_ELT, "html")       ! Root node
  Head:= addnode(ResultHTML, Root, XML_ELT, "head")    ! Element node
  Style:= addnode(ResultHTML, Head, XML_ELT, "style",
    "body {font-family: Verdana, Geneva, Helvetica, Arial, sans-serif;" +
    " color: 003f5f; background-color: d8e3e9 }\n" +
    "table td {background-color: e9e3db; color: 003f5f; text-align: right }\n" +
    "table th {background-color: f7c526; color: 003f5f}")
  setattr(ResultHTML, Style, "type", "text/css")       ! Set an attribute

  Body:= addnode(ResultHTML, Root, XML_ELT, "body")    ! Body of HTML page
  Title:= addnode(ResultHTML, Body XML_ELT, "h2", "Transportation Plan")

  Table:= addnode(ResultHTML, Body, XML_ELT, "table")  ! 'table' element
  setattr(ResultHTML, Table, "width", '100%')          ! Set some attributes
  setattr(ResultHTML, Table, "border", 0)
  Row:= addnode(ResultHTML, Table, XML_ELT, "tr")      ! Table row element
  EmptyCell:= addnode(ResultHTML, Row, XML_ELT, "td")  ! Table cell element
  setattr(ResultHTML, EmptyCell, "width", '5%')        ! Set an attribute
  Cell:= addnode(ResultHTML, Row, "td", "Total cost: " +
                 textfmt(MinCost.sol,6,2))  ! Table cell element with contents
  Cell:= addnode(ResultHTML, Cell, XML_DATA, "£") ! DATA node
  Cell:= addnode(ResultHTML, Row, "td", text(datetime(SYS_NOW)))
  EmptyCell:=                               ! Node created by copying a node
    copynode(ResultHTML, EmptyCell, ResultHTML, Row, XML_LASTCHILD)
...

  save(ResultHTML, "transportres.html")     ! Write the HTML file
  save(ResultHTML, Table, "")               ! Display table def. on screen
The resulting HTML page might now look as shown in Figure HTML page generated by Mosel.

Figure 21.2: HTML page generated by Mosel
Xpress Insight
For embedding a Mosel model into Xpress Insight, we make a few edits to the model. All functionality that is needed to establish the connection between Mosel and Xpress Insight is provided by mminsight that now needs to be loaded. Since Xpress Insight manages the data scenarios, we only need to read in data from the original sources when loading the so-called baseline scenario into Xpress Insight (triggered by the test of insightgetmode=INSIGHT_MODE_LOAD in the model below), for model runs started from Xpress Insight (that is, in the case of insightgetmode=INSIGHT_MODE_RUN) the scenario data will be input directly from Xpress Insight at the insertion point marked with insightpopulate. For standalone execution (insightgetmode=INSIGHT_MODE_NONE) the model defaults to its original behavior, that is, reading the data from file followed by definition and solving of the optimization problem. Furthermore, the solver call to start the optimization is replaced by insightminimize / insightmaximize. Please also note that any model entities to be managed by Xpress Insight need to be declared as public—in the following code example this marker has been applied to the entire declarations block, alternatively it can be added to individual entity declarations.
model "Transport (Xpress Insight)"
 uses "mmxprs", "mminsight"

 public declarations
  REGION: set of string                 ! Set of customer regions
  PLANT: set of string                  ! Set of plants

  DEMAND: array(REGION) of real         ! Demand at regions
  PLANTCAP: array(PLANT) of real        ! Production capacity at plants
  PLANTCOST: array(PLANT) of real       ! Unit production cost at plants
  TRANSCAP: dynamic array(PLANT,REGION) of real
                                        ! Capacity on each route plant->region
  DISTANCE: dynamic array(PLANT,REGION) of real
                                        ! Distance of each route plant->region
  FUELCOST: real                        ! Fuel cost per unit distance

  MaxCap: array(PLANT) of linctr        ! Capacity constraints
  flow: dynamic array(PLANT,REGION) of mpvar    ! Flow on each route
 end-declarations

 procedure readdata                     ! Data for baseline
  initializations from 'transprt.dat'
   DEMAND
   [PLANTCAP,PLANTCOST] as 'PLANTDATA'
   [DISTANCE,TRANSCAP] as 'ROUTES'
   FUELCOST
  end-initializations
 end-procedure

 case insightgetmode of
  INSIGHT_MODE_LOAD: do
     readdata                           ! Input baseline data and
     exit(0)                            ! stop the model run here
    end-do
  INSIGHT_MODE_RUN: insightpopulate     ! Inject scenario data and continue
  INSIGHT_MODE_NONE: readdata           ! Input baseline data and continue
  else
    writeln("Unknown run mode")
    exit(1)
 end-case

! Create the flow variables that exist
 forall(p in PLANT, r in REGION | exists(TRANSCAP(p,r)) ) create(flow(p,r))

! Objective: minimize total cost
 MinCost:= sum(p in PLANT, r in REGION | exists(flow(p,r)))
            (FUELCOST * DISTANCE(p,r) + PLANTCOST(p)) * flow(p,r)

! Limits on plant capacity
 forall(p in PLANT) MaxCap(p):= sum(r in REGION) flow(p,r) <= PLANTCAP(p)

! Satisfy all demands
 forall(r in REGION) sum(p in PLANT) flow(p,r) = DEMAND(r)

! Bounds on flows
 forall(p in PLANT, r in REGION | exists(flow(p,r)))
  flow(p,r) <= TRANSCAP(p,r)

 insightminimize(MinCost)               ! Solve the problem through Xpress Insight
The handling of model entities by Xpress Insight can be configured via annotations (see Chapter Annotations for detail), for example to define aliases to be displayed in the UI in place of the model entity names, or to select which data entities are to be treated as inputs or results respectively. The annotations defined by Xpress Insight form the category insight, the following model extract shows some example definitions for the 'Transport' problem, please refer to the Xpress Insight Mosel Interface Manual for a complete documentation.
 !@insight.manage=input
 public declarations
  !@insight.alias Customer regions
  REGION: set of string                 ! Set of customer regions
  !@insight.alias Plants
  PLANT: set of string                  ! Set of plants
  !@insight.alias Demand
  DEMAND: array(REGION) of real         ! Demand at regions
  !@insight.alias Production capacity
  PLANTCAP: array(PLANT) of real        ! Production capacity at plants
  !@insight.alias Unit production cost
  PLANTCOST: array(PLANT) of real       ! Unit production cost at plants
  !@insight.alias Capacity on each route
  TRANSCAP: dynamic array(PLANT,REGION) of real
  !@insight.alias Distance per route
  DISTANCE: dynamic array(PLANT,REGION) of real
  !@insight.alias Fuel cost per unit distance
  FUELCOST: real                        ! Fuel cost per unit distance
 end-declarations

 !@insight.manage=result
 public declarations
  !@insight.alias Production capacity limits
  MaxCap: array(PLANT) of linctr        ! Capacity constraints
  !@insight.alias Amount shipped
  flow: dynamic array(PLANT,REGION) of mpvar    ! Flow on each route
  !@insight.hidden=true
  MincostSol: real
  !@insight.alias Total
  pltotal: array(PLANT) of real         ! Solution: production per plant
 end-declarations
Xpress Insight expects models to be provided in compiled form, that is, as BIM files. An Xpress Insight app archive is a ZIP archive that contains the BIM file and the optional subdirectories model_resources (data files), client_resources (custom view definitions), and source (Mosel model source files). When developing an Insight app with Xpress Workbench, select the button ![]() to create the app archive or
to create the app archive or ![]() to publish the app directly to Insight.
to publish the app directly to Insight.

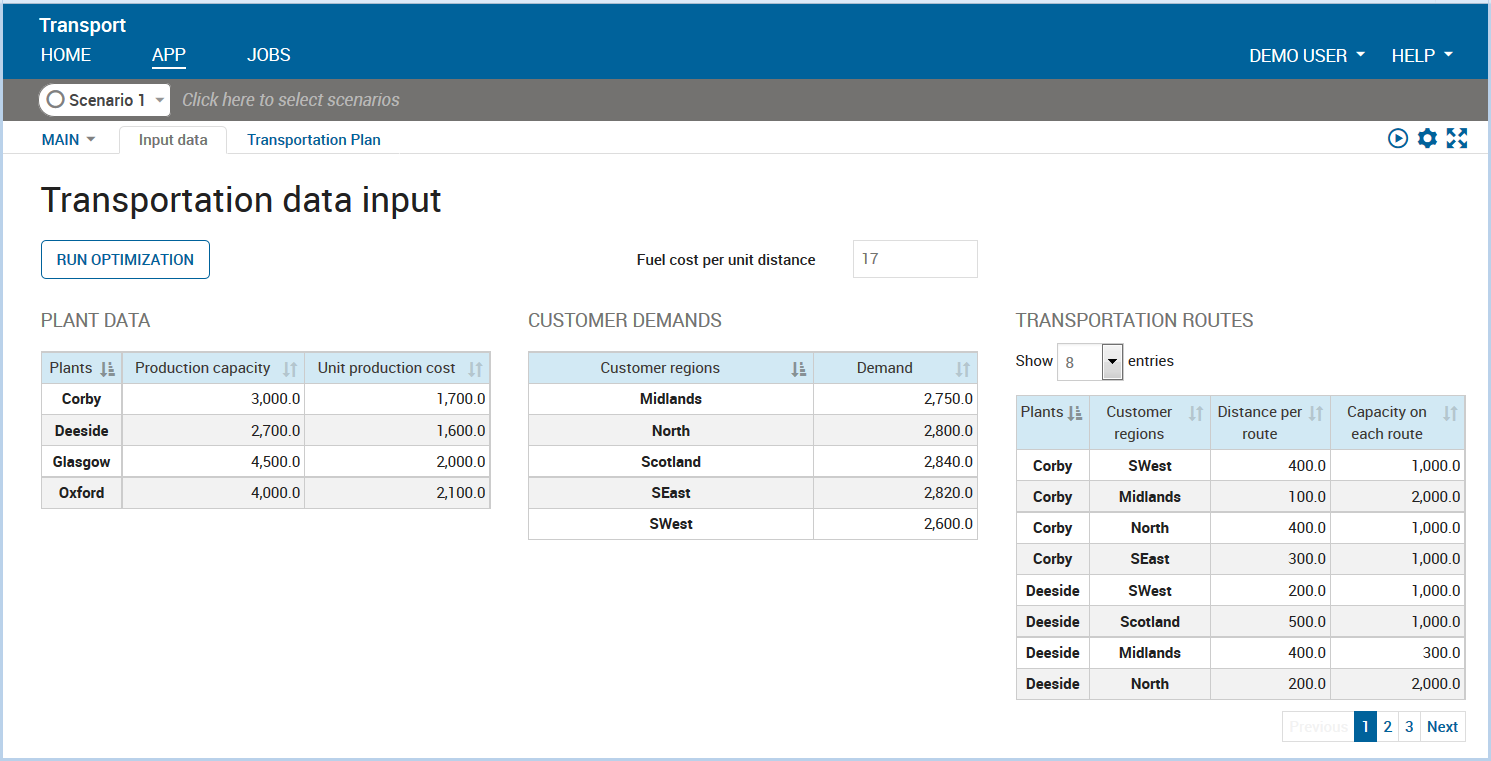
Figure 21.3: Xpress Insight web view showing a VDL view for the transportation problem
If we wish to deploy an optimization app to the Xpress Insight Web Client we need to take into account that besides the 'Entity browser' view that lists all managed model entities there are no default views: any visualization of input or result data needs to be explicitly implemented as views. The screenshot in Figure Xpress Insight web view showing a VDL view for the transportation problem shows a VDL (View Definition Language) view for the transportation example with editable input data and a 'Run' button that triggers re-solving of the optimization problem with the scenario data displayed on screen. The complete set of files is provided in the app archive transport_insight.zip. Please refer to the Xpress Insight Developer Manual for further detail on view definition using the VDL markup language or the Xpress Insight Javascript API.

