Input Data
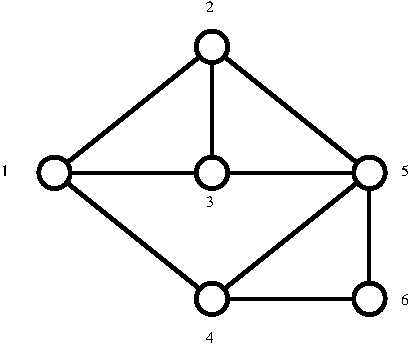
Consider the network depicted in Figure Network topology, where each link represents two arcs in opposite directions. Table Maximum incoming/outgoing demand below reports the parameters specified in the data file vpn_data.dat describing the uncertainty set, i.e., the maximum incoming and outgoing traffic demands for each node of the network.

Figure 5: Network topology
| Node | Incoming | Outgoing |
|---|---|---|
| 1 | 120 | 105 |
| 2 | 34 | 95 |
| 3 | 35 | 82 |
| 4 | 101 | 102 |
| 5 | 78 | 76 |
| 6 | 75 | 140 |
Table Arc costs describes instead the arc cost for every arc (i,j) used in the network (a ``–'' means that no connection exists).
| i/j | 1 | 2 | 3 | 4 | 5 | 6 |
|---|---|---|---|---|---|---|
| 1 | – | 10 | 9 | 12 | – | – |
| 2 | 8 | – | 10 | – | 12 | – |
| 3 | 10 | 7 | – | – | 9 | – |
| 4 | 10 | – | – | – | 12 | 5 |
| 5 | – | 9 | 8 | 11 | – | 12 |
| 6 | – | – | – | 10 | 9 | – |

