
Code Samples - Using VDL to Create Custom Views
Start of chapter
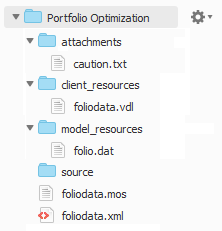
Folder Structure for this Chapter's Example
<vdl version="4.6">
  <vdl-page>
        <vdl-section heading-level="1" heading="Welcome to Portfolio Optimization">
            <vdl-row>
                <vdl-column heading="INPUT DATA" size="6">
                    <vdl-table page-mode="paged" page-size="5">
                        <vdl-table-column entity="RET" editable="true"></vdl-table-column>
                    </vdl-table>
                </vdl-column>
                <vdl-column heading="CONFIGURE THE BASIS FOR YOUR DECISION" size="6">
                    <vdl-form>
                        <vdl-field label="Max investment per share" parameter="MAXVAL" size="4">
                            <vdl-tooltip title="Maximum Investment per share" content="Specify the expected investment in a share category"></vdl-tooltip>
                            <vdl-validate pass="=value >= 0"><span vdl-text="Investment must be zero or greater."></span></vdl-validate>
                        </vdl-field>
                        <vdl-field label="Max investment in high risk shares" size="4" parameter="MAXRISK">
                            <vdl-tooltip title="Maximum High Risk Investment" content="Specify how much to invest in High Risk Shares"></vdl-tooltip>
                            <vdl-validate pass="=value <= 200"><span vdl-text="Max investment per share is limited to 200."></span></vdl-validate>
                        </vdl-field>
                    </vdl-form>
                    <vdl-execute-button caption="Run Optimization" mode="RUN"></vdl-execute-button>
                </vdl-column>
            </vdl-row>
            <vdl-section>
                <vdl-row>
                    <vdl-column heading="RESULTS" size="6">
                        <span vdl-text="='Calculated'+' '+'Optimal'+' '+'Return' +'   '"></span>
                        <span vdl-text="=insight.Formatter.formatNumber(scenario.entities.Return.value, '00.##')"></span>
                        <vdl-table column-filter="true" show-filter="true" page-mode="paged" page-size="5">
                            <vdl-table-column set="SHARES"></vdl-table-column>
                            <vdl-table-column entity="frac"></vdl-table-column>
                        </vdl-table>
                    </vdl-column>
                    <vdl-column heading="SCENARIO COMPARISON" size="6">
                        <vdl-chart>
                            <vdl-chart-series entity="frac" type="pie" scenario="=i" vdl-repeat="=s,i in scenarios"></vdl-chart-series>
                        </vdl-chart>
                    </vdl-column>
                </vdl-row>
            </vdl-section>
        </vdl-section>
    </vdl-page>
</vdl>
! Data file for `folio*.mos'
RET: [("treasury") 5 ("hardware") 17 ("theater") 26 ("telecom") 12
("brewery") 8 ("highways") 9 ("cars") 7 ("bank") 6
("software") 31 ("electronics") 21 ]
DEV: [("treasury") 0.1 ("hardware") 19 ("theater") 28 ("telecom") 22
("brewery") 4 ("highways") 3.5 ("cars") 5 ("bank") 0.5
("software") 25 ("electronics") 16 ]
NAMES: ["treasury" "hardware" "theater" "telecom" "brewery" "highways" "cars"
"bank" "software" "electronics"]
COUNTRY: ["Canada" "USA" "USA" "USA" "UK" "France" "Germany" "Luxemburg" "India"
"Japan"]
RISK: ["hardware" "theater" "telecom" "software" "electronics"]
NA: ["treasury" "hardware" "theater" "telecom"]
cautionText:"** Text to be replaced **"
model "Portfolio optimization with LP"
    uses "mminsight" ! For Xpress Insight
    uses "mmxprs" ! Use Xpress Optimizer
    parameters
        DATAFILE= "folio.dat" ! File with problem data
        OUTFILE= "result.dat" ! Output file
        MAXRISK = 1/3 ! Max. investment into high-risk values
        MAXVAL = 0.3 ! Max. investment per share
        MINAM = 0.5 ! Min. investment into N.-American values
    end-parameters
    public declarations
        !@insight.manage input
        !@insight.alias Set of all shares
        SHARES: set of string ! Set of shares
        !@insight.manage input
        !@insight.alias Set of high risk shares
        RISK: set of string ! Set of high-risk values among shares
        !@insight.manage input
        !@insight.alias Set of all North American shares
        NA: set of string ! Set of shares issued in N.-America
        !@insight.manage input
        !@insight.alias Estimated ROI per share
        RET: array(SHARES) of real ! Estimated return in investment
        !@insight.manage input
        changeShare: string
    end-declarations
    forward procedure datainput
    case insightgetmode of
        INSIGHT_MODE_LOAD: do
            datainput
            exit(0)
        end-do
        INSIGHT_MODE_RUN:
            insightpopulate
    else
        datainput
    end-case
    procedure datainput
        initializations from DATAFILE
            RISK RET NA
        end-initializations
        changeShare:="brewery"
    end-procedure
    public declarations
        !@insight.manage result
        !@insight.alias Outcomes
        frac: array(SHARES) of mpvar ! Fraction of capital used per share
        !@insight.alias Return
        Return: linctr   ! Objective fuction: total return
    end-declarations
    ! Objective: total return
    Return:= sum(s in SHARES) RET(s)*frac(s)
    ! Limit the percentage of high-risk values
    sum(s in RISK) frac(s) <= MAXRISK
    ! Minimum amount of North-American values
    sum(s in NA) frac(s) >= MINAM
    ! Spend all the capital
    sum(s in SHARES) frac(s) = 1
    ! Upper bounds on the investment per share
    forall(s in SHARES) frac(s) <= MAXVAL
    ! Solve the problem
    insightmaximize(Return)
    ! Solution printing to a file
    fopen(OUTFILE, F_OUTPUT)
    writeln("Total return: ", getobjval)
    forall(s in SHARES)
    writeln(strfmt(s,-12), ": \t", strfmt(getsol(frac(s))*100,5,2), "%")
    fclose(F_OUTPUT)
end-model
<?xml version="1.0" encoding="UTF-8"?>
<model-companion xmlns="http://www.fico.com/xpress/optimization-modeler/model-companion" version="3.0">
  <client>
    <view-group title="Portfolio Optimization">
        <vdl-view title="Portfolio" path="foliodata.vdl"></vdl-view>
    </view-group>
  </client>
</model-companion>
© 2001-2019 Fair Isaac Corporation. All rights reserved. This documentation is the property of Fair Isaac Corporation (“FICO”). Receipt or possession of this documentation does not convey rights to disclose, reproduce, make derivative works, use, or allow others to use it except solely for internal evaluation purposes to determine whether to purchase a license to the software described in this documentation, or as otherwise set forth in a written software license agreement between you and FICO (or a FICO affiliate). Use of this documentation and the software described in it must conform strictly to the foregoing permitted uses, and no other use is permitted.