
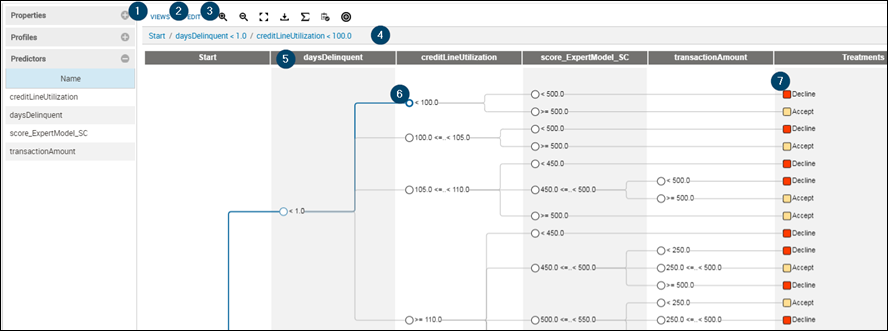
Decision Tree User Interface
In the Tree View, you can manually create or edit splits, and create and assign treatments.
With the menu on the left, you can:
- expand panels to view the properties of the attachment.
- view and select predictors as candidate split variables for the decision tree.
- view and add selected profile variables for profiling the decision tree, to observe how input records are processed at each node—When you profile a decision tree, you choose one or more variables to follow through as the input data is processed.
At the bottom of the Profiles and Predictors panels you can add, delete, and search. You can also search for predictors or profile variables listed in their respective panels.
- Click the Predictors column heading to expand the panel.
- Click Add to open the Select Predictors dialog box, where you can add or delete candidate split variables for the decision tree (The list contains the numeric Account Attributes marked as Possible tree variables in the Data Roles > Configure Roles for Input Data pane.)
- You can also select a predictor in the panel and click Delete, providing that predictor is not used in the decision tree. Deleting a predictor only removes it from the panel and does not remove it from the dataset.
- Click the Profiles column heading to expand the panel.
- Click Add to open the Choose variables to profile dialog box, where you can add or delete profile variables to view statistical information for each tree node.
- You can also select a profile variable in the panel and click Delete. Deleting a profile variable only removes it from the panel and does not remove it from the dataset.
- Two treatments—Decline or Accept
- Six levels, including the start level
- Several splits
- A selected node
Tree View
- VIEWS controls how your decision tree is displayed.
- Tree View (default): Edit and refine your tree.
When Tree View is enabled, three different representations of the nodes can be selected:
- Compact—Displays node conditions and treatments without statistics (default view).
- Counts—Displays node conditions and treatments, as well as the total number of counts (#T) and weighted percentage of the total (W%T).
- Counts-labels—Displays node conditions and treatments, as well as the total number of counts (#T) and weighted percentage of the total (W%T), with their respective labels.
You can view the distribution by color for each node in the Counts and Counts-labels views by selecting:- Color by Treatments—Each node displays the weighted percentage of the total number of records assigned a treatment. Hover the mouse pointer over each treatment color to view the percentage of the population assigned to that treatment. The colors can be edited via the Assign Treatments dialogue, for more see Treatments and Decision Trees. The data in the decision tree must be counted to show this information.
- Color by <target variable>—This view shows the proportion of target outcomes in each node, using the default target definition colors—The default target definition colors can not be edited. The coloring of each node uses the Rate statistic, which lists the percent of counts for each value (outcome) that contribute to the selected target variable. In the Profile View, for a given node, the sum of the Rate for each target value equals 100%.
- No Color—Do not display a color.
- Profile View or Leaf View—Profile your tree variables and analyze treatments using leaf node statistics.
 Note To use these views, you need to specify which of your tree variables are to be used as profiling variables. For more information on profile variables, see the previous topic Setting up Data Roles for Account Input Data, and Choosing Profiling Statistics later in this topic.
 - Treatment Summary: Profile the treatments and provides aggregated count and weighted count per treatment.
The decision tree toolbar contains commands that let you edit, cut, copy, paste, or delete decision tree elements. Additionally, you can change the magnification of the decision tree by zooming in, out, or to fit the canvas.
- Tree View (default): Edit and refine your tree.
- Edit displays the options to edit the tree. Possible actions are:
- Edit split to modify the conditions of the split.
- Insert split to add a condition node with branches.
- Cut tree to edit subtrees.
- Copy tree to edit subtrees.
- Clear tree to remove all nodes below the selected one
- Collapse subtree hides all nodes and edges below the selected node, and displays an arrow
 icon to indicate more information is available—click the arrow to reveal the subtree.
 - Collapse entire tree hides all nodes and edges below the Start node, and displays an arrow icon to indicate more information is available—click the arrow to reveal the subtree.
- Toolbar:

Zoom in/out/to fit 
Download the tree as FSML file 
Recount 
Add, Delete and Modify Treatments 
Set Target Variables 
(Available when Target variable is set) Automatically determine and include the best split for a node, for more see Determining Best Split later in this topic.

Explore Recommended Splits(Available when Target variable is set) Suggest splitting values, for more see Determining Best Split later in this topic.
- Node path: Contains a textual representation of the node path to the currently selected element.
- Level: Each vertical band in the tree, known as a level, corresponds to a variable marked as a Possible tree variable in the Data Roles > Configure Roles for Input Data pane (except the Start level and the Treatments level).
- Condition node: A conditional branching point in a decision tree. This node is displayed as a circle in Compact view or as a rectangle containing statistics in the Counts or Counts-label views.
- Treatments: The column furthest right in a decision tree displays the color-coded treatments applied to the end or leaf nodes.
© 2001-2019 Fair Isaac Corporation. All rights reserved. This documentation is the property of Fair Isaac Corporation (“FICO”). Receipt or possession of this documentation does not convey rights to disclose, reproduce, make derivative works, use, or allow others to use it except solely for internal evaluation purposes to determine whether to purchase a license to the software described in this documentation, or as otherwise set forth in a written software license agreement between you and FICO (or a FICO affiliate). Use of this documentation and the software described in it must conform strictly to the foregoing permitted uses, and no other use is permitted.