With the mirror tables and data source defined, the example project is ready for its first Tableau view.
With the changes made to the
foliodata.xml file as described:
- Republish your app to Xpress Insight.
There is no need to visit the
Xpress Insight screen.
- Click the Edit Tableau workbooks icon
 from within Xpress Workbench.
- When prompted with the message To continue, you must select at least one scenario, click Scenario 1 in the scenario list (it will be the only item in the list) and then click Continue.
In a few moments you are connected to the server-based version of Tableau in a new browser tab.
- Choose Data sources in the main menu, and then click shares_share_source in the list of data sources list—this is the concatenation of the mirror table prefix and the data source name configured in the previous section.
- Click the new workbook icon
 in the main menu.
- Right click the tab name at the bottom of the page and select Rename sheet to give the sheet the name ROI.
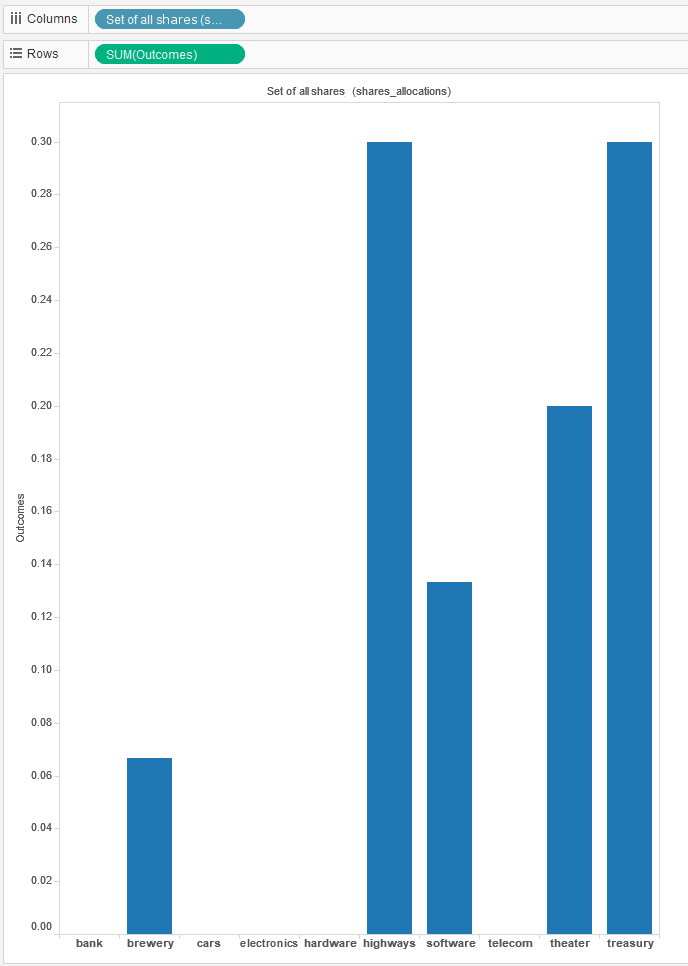
- Expand the shares_allocations entry in the Dimensions panel on the left and drag the Set of all shares dimension into the Columns field of the main central pane.
- Expand the shares_allocations entry in the Measures panel on the left and drag the Outcomes measure into the Rows field of the main central pane.
In a few moments, a bar chart showing the recommended allocation of share types appears.

Recommended Share Allocations
- Click in the main menu, give the saved workbook a name, investments, and click Save, leaving everything else at their default values.
- Return to the Xpress Workbench tab and republish and visit the app, reloading and running the main scenario if necessary.
The app has a new tab called ROI which displays the bar chart in its runtime mode. You can switch between the various tabs to modify the ROI per share type and review its effects on the visualization.
Note that the tableau folder of the app has been populated with a file called investments.twb—this is the Tableau workbook file, and needs to be present in the folder if you have marked the workbook as managed in the companion file.
This simple Tableau view illustrates one method of integrating
Xpress Insight with Tableau, and barely scratches the surface of the many visualizations that Tableau makes possible. Refer to the official Tableau documentation for more detailed information about how to harness its full capabilities.
© 2001-2020 Fair Isaac Corporation. All rights reserved. This documentation is the
property of Fair Isaac Corporation (“FICO”). Receipt or possession of this documentation does not
convey rights to disclose, reproduce, make derivative works, use, or allow others to use it except
solely for internal evaluation purposes to determine whether to purchase a license to the software
described in this documentation, or as otherwise set forth in a written software license agreement
between you and FICO (or a FICO affiliate). Use of this documentation and the software described in
it must conform strictly to the foregoing permitted uses, and no other use is permitted.


 from within Xpress Workbench.
  in the main menu.