
The MIP search tab of the Run Bar
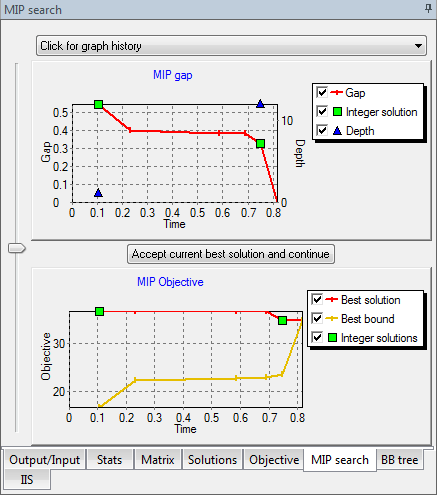
The graph on top shows the evolution in time of the MIP gap during the global search. Also shown are the points where the integer solutions were found and the depth in the search tree at which each solution was found.
The graph below shows the progress of the current best integer solution objective relative to the best bound. Integer solutions are marked as well.
- The graphs can be zoomed in and out and each curve can be shown or hidden using the checkboxes in the graph legend.
- Use the slider bar to change the vertical size of either graph.
- Pressing the button "Accept current best solution and continue" will terminate the MIP search but the execution of the Mosel model will continue. This behavior is unlike that of the Stop button, which stops the entire model.
- Xpress-IVE maintains a history of the last ten graphs produced. Select the desired graph from the list at the top. Note that the graph history cannot be accessed during an optimization.
© 2001-2020 Fair Isaac Corporation. All rights reserved. This documentation is the property of Fair Isaac Corporation (“FICO”). Receipt or possession of this documentation does not convey rights to disclose, reproduce, make derivative works, use, or allow others to use it except solely for internal evaluation purposes to determine whether to purchase a license to the software described in this documentation, or as otherwise set forth in a written software license agreement between you and FICO (or a FICO affiliate). Use of this documentation and the software described in it must conform strictly to the foregoing permitted uses, and no other use is permitted.