Results
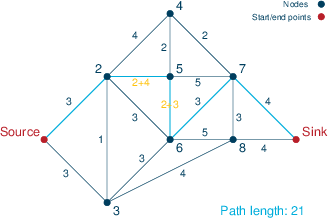
Figure Robust solution with 2 delays shows the path through the network defined by the robust solution; it has a total length of 21. The path it follows, i.e., Source → 2 → 5 → 6 → 7 → Sink, has a nominal length of 14, but if roads 2–5 and 5–6 have construction work we must add a total delay of 7. Given that these two roads have maximum delay (together with the combination of roads 2–5 and 6–7), any other combination of at most two roads with construction will result in a total duration of 21 minutes or less. The delay that we must add to the nominal length of the path is given by the sum of the solution values of the uncertains delay(a) associated with every arc a in the path. The solution values of the uncertains delay can be interpreted as providing an answer to the question 'which is the worst possible choice of delays for the selected path?'. The resulting values of the uncertains place the delay on the two arcs (2,5) and (5,6) for a total delay of 7.
Delay on (2,5): 4
Delay on (5,6): 3

Figure 2: Robust solution with 2 delays
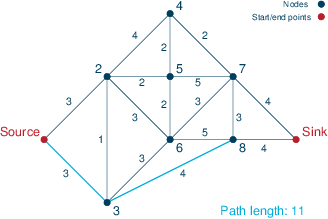
Consider now the solution in Figure Zero-delay solution, obtained by ignoring the delays caused by road work. The optimal path in this case is Source → 3 → 8 → Sink, with a total duration of 11. However, this is a very optimistic solution as in the worst case the roads Sink–3 and 3–8 may have construction work, in which case the travel time increases by 13 minutes to 24, clearly worse than the robust solution of 21 minutes.

Figure 3: Zero-delay solution
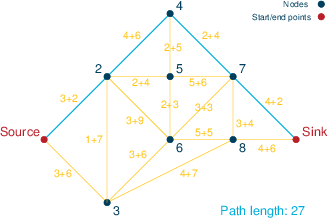
Finally, let us take a look at the solution obtained by setting all arc costs to their maximum value, i.e., a shortest path computed on a graph where all edges are assumed to have their maximum delay. As shown in Figure Maximum-delay solution, the solution is the path Source → 2 → 4 → 7 → Sink, and has a duration of 27 minutes. Under the assumption that at most two roads have construction work, this travel time is meaningless: in fact, the nominal travel time is 13 minutes and the worst-case travel time is obtained with road work on 2–4 and 4–7, which add 10 minutes to the solution and hence yield a total travel time of 23, still worse than the robust shortest path of 21 depicted above.

Figure 4: Maximum-delay solution
We recap the above results in Table Path costs, which shows the worst-case travel times for the paths determined by the three approaches (robust for N=2, shortest path with nominal values, shortest path where all roads have maximum delay) in five cases: no road work, road work in N=1, 2, or 3 edges of the graph, and road work everywhere, i.e. N is infinite.
| N | 0 | 1 | 2 | 3 | +inf | Path |
|---|---|---|---|---|---|---|
| Robust | 14 | 18 | 21 | 24 | 28 | Source → 2 → 5 → 6 → 7 → Sink |
| Nominal | 11 | 18 | 24 | 30 | 30 | Source →3 →8 → Sink |
| All delays | 13 | 19 | 23 | 25 | 27 | Source → 2 → 4 → 7 → Sink |
The values in this table can be obtained by fixing the arc selection in the robust problem to a given path and re-solving it for different values of N (i.e. we determine the worst-case delay for a given path that satisfies all constraints of the robust problem).
Note that, under the assumption we have made at the beginning of this section, the only solution that truly solves the problem with minimum worst-case travel time is the one that was found using the uncertains to model our knowledge, albeit limited, of the road works in this network.
© 2001-2020 Fair Isaac Corporation. All rights reserved. This documentation is the property of Fair Isaac Corporation (“FICO”). Receipt or possession of this documentation does not convey rights to disclose, reproduce, make derivative works, use, or allow others to use it except solely for internal evaluation purposes to determine whether to purchase a license to the software described in this documentation, or as otherwise set forth in a written software license agreement between you and FICO (or a FICO affiliate). Use of this documentation and the software described in it must conform strictly to the foregoing permitted uses, and no other use is permitted.

