The source file included in the demo folder imports a data file that contains a set of share categories and allocates an estimated return on investment for each. We can create an interface to be able to update this data. To follow best practice, the contents of an array can be displayed in a table.
- In the Palette> Components group, click and drag a Table element onto the INPUT DATA Column. Proceed through each page of the Table wizard before clicking Finish:
- In the first wizard page, select which entities will be used as columns in the table. Select three entities:
- Shares_HighRisk
- Shares_NorthAmerica
- Shares_Return
You can click a selected entity to de-select. Entities are highlighted yellow when selected. Click NEXT.
|
|
Note The
Shares_Return value displays the estimated return on investment calculated in the model.
|
- In the CUSTOMIZE window, click the Editable check box for Expected Return on Investment.
- Click FINISH.
- Optionally, set the Pagination and Page size Options for the new table. Select the new Table element and click the Attributes tab, then expand the Options pane to edit the attributes. Set:
- Pagination to paged by selecting from the drop down.
- Page size to 5.
- View Designer enable you to edit which columns are in a table. To delete a column, select a column in the table and either press the delete key on your keyboard, or use the delete icon in the action toolbar. To add a column, drag a Table Column element from the Palette onto the table.
- Add a column to the table. Drag a Table Column element from the Palette and drop it onto the Table.
- Select the new Table Column. In the Attributes column, DATA pane, select ShareIds from the Set drop down.
- Use the action toolbar to move the column to the leftmost position in the table - With the column selected, click the Move before any preceding adjacent element (left arrow) three times.
- In the Palette > Actions group, click and drag an Execute Model element onto the Section on the artboard.
A new
Header element is added to the VDL view, containing an action group. The action group is labeled
Execute Model. The
Attributes panel,
Main pane, ensure the value in the
Mode drop-down is set to
RUN.
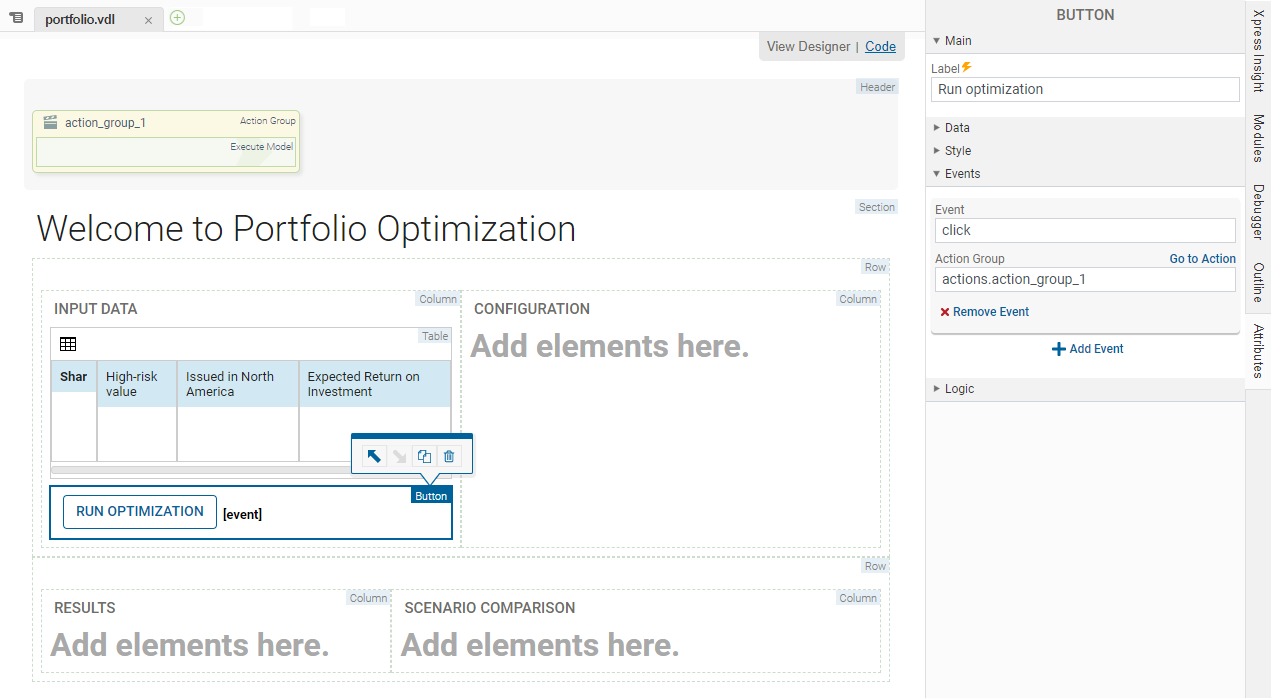
- In the Palette > Components group, click and drag a Button element onto the INPUT DATA Column on the artboard.
- With the Button selected on the artboard, make the following changes:
- In Attributes > Events, click Add Event.
- In Attributes > Events > Event, select click.
- In Attributes > Events > Actions Group select actions.action_group_1.
- Edit Attributes > Main > Label to say RUN OPTIMIZATION.
Column Filtering
Optionally, you can enable column filters by selecting the
Column Filters check box. When the table is published, the column can be filtered using a single range filter per column. The available filter range operators are:
=,
<,
>,
<=,
>=,
!=.
|
|
Note If column contains text strings, the range operators are treated as part of the search string.
|
© 2001-2020 Fair Isaac Corporation. All rights reserved. This documentation is the
property of Fair Isaac Corporation (“FICO”). Receipt or possession of this documentation does not
convey rights to disclose, reproduce, make derivative works, use, or allow others to use it except
solely for internal evaluation purposes to determine whether to purchase a license to the software
described in this documentation, or as otherwise set forth in a written software license agreement
between you and FICO (or a FICO affiliate). Use of this documentation and the software described in
it must conform strictly to the foregoing permitted uses, and no other use is permitted.

 Note The Shares_Return value displays the estimated return on investment calculated in the model.