
Binding the User Interface to Scenario Data
- In the Palette > Components group, click and drag a Table element onto the RESULTS Column element on the artboard. In the Table wizard:
- Select the Shares_fraction entity by clicking on it.
 Tip The Shares_fraction entity was created in the model source file to calculate the fraction of capital used per share.
 - Click FINISH to display the table.
- Select the Shares_fraction entity by clicking on it.
- Select the new Table Column. Edit the following attributes:
- Set DATA > Set to ShareIds.
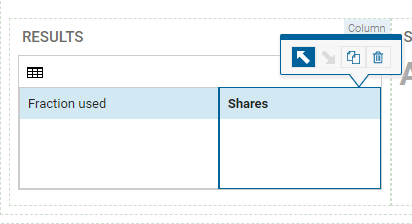
Tip This tables displays the Shares alias created in the model source file to display the share type associated to the Fraction of capital used per share value
- Set DATA > Set to ShareIds.
- On the artboard, select the new Table Column element and use the action toolbar to move it to the left of the Fraction used Column.
- The expected return on investment can be edited directly in the INPUT DATA table. The scenario can be run as required using the RUN OPTIMIZATION button.
- The fields in the header row come automatically equipped with small widgets that enable column sorting.
- The RESULTS table:
- displays a data table detailing the proportion of capital allocated to each share type.
- displays the pagination control to display on the bottom right. The drop-down menu in the pagination control enables page navigation and selection of the number of entries per page.
- has a Search box enabled at the top, while the ticked box for Column Filters has enabled search boxes at the top of each column.
- has 5 rows as configured and displays both the entries and the corresponding index entries for the Shares_fraction entity. Column headings reflect the aliases assigned in foliodata.mos.
The app has a production-ready table that is bound to the underlying model data. As a user interface developer, you do not need to worry about lower level concerns like data marshaling and synchronization, styling, implementing search, and pagination.
© 2001-2020 Fair Isaac Corporation. All rights reserved. This documentation is the property of Fair Isaac Corporation (“FICO”). Receipt or possession of this documentation does not convey rights to disclose, reproduce, make derivative works, use, or allow others to use it except solely for internal evaluation purposes to determine whether to purchase a license to the software described in this documentation, or as otherwise set forth in a written software license agreement between you and FICO (or a FICO affiliate). Use of this documentation and the software described in it must conform strictly to the foregoing permitted uses, and no other use is permitted.