
Creating Charts
View Designer
- In the Palette > Components group, click and drag the Chart element onto a Parent element. The Chart wizard is displayed. For this simple initial example, click FINISH.
-
To select the type of chart, add a Chart Series Component. In the Palette > Components group, click and drag the Chart Series element onto the Chart. Select the Chart Series element on the artboard.
- Edit the Attributes in the Attributes pane.
- Select bar(default) from the Type drop down.
-
In Data> Data, enter "=[10,3,20]".
- In the Palette > Components group, click and drag the Chart Series element onto the Chart. Select the Chart Series element on the artboard. Edit the Attributes in the Attributes pane.
- In Data > Data, enter "=[15,24,9]".
- In the Palette > Components group, click and drag the Chart Series element onto the Chart. Select the Chart Series element on the artboard. Edit the Attributes in the Attributes pane.
-
In Data > Data, enter "=[25,14,4,18]".
-
When published to Xpress Insight, this renders as:
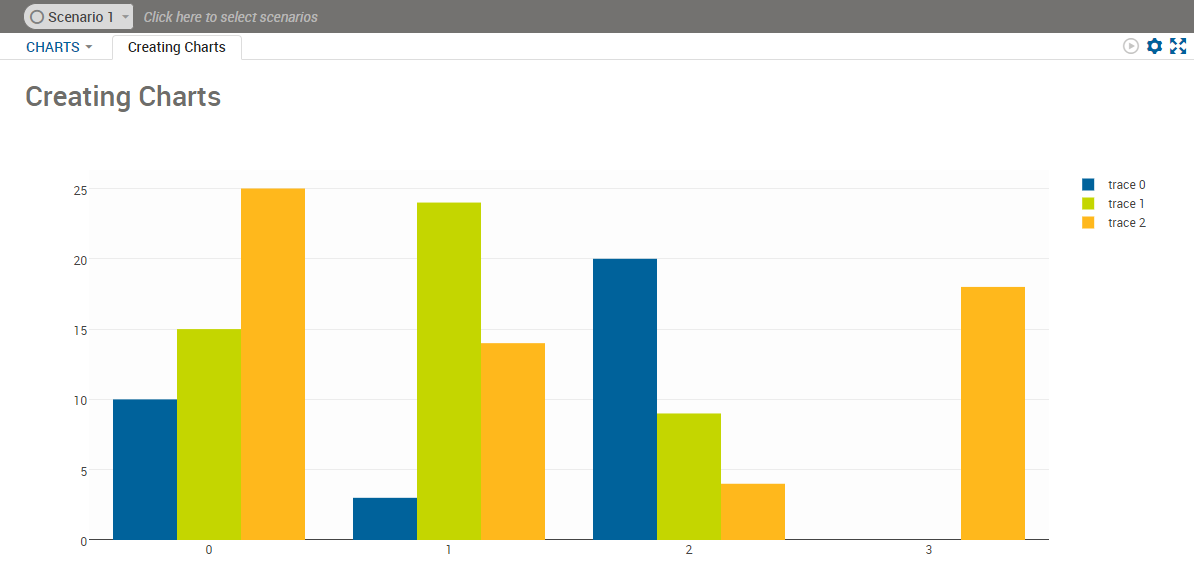
Bar Chart from the View Designer
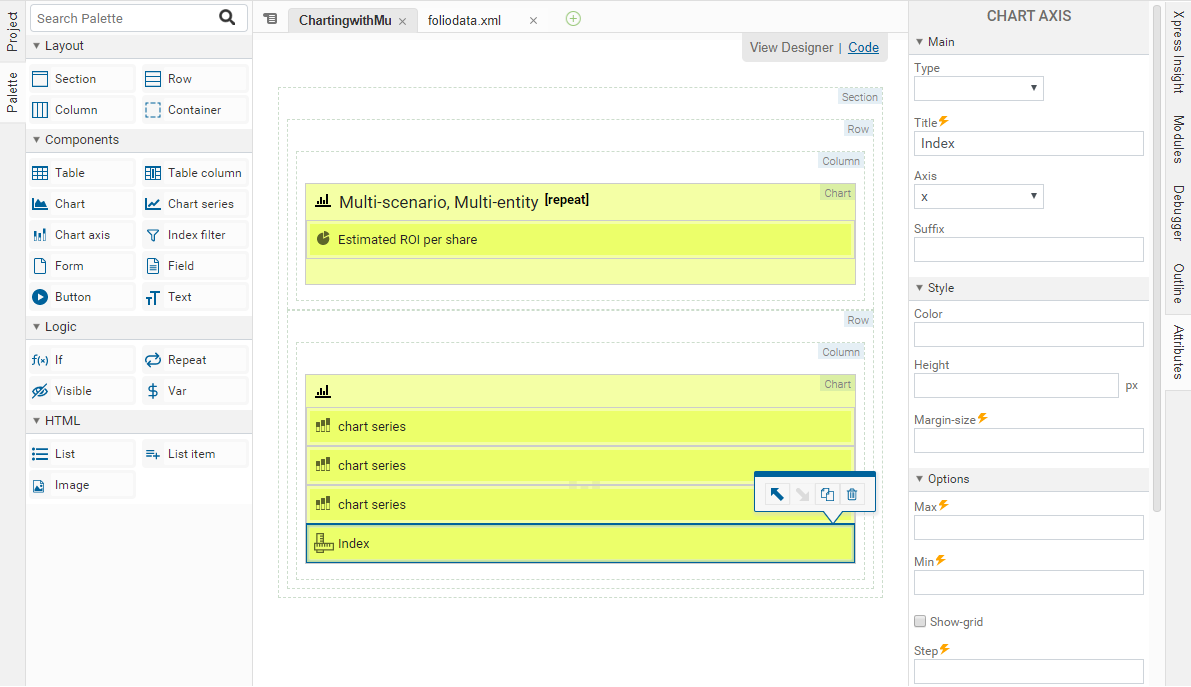
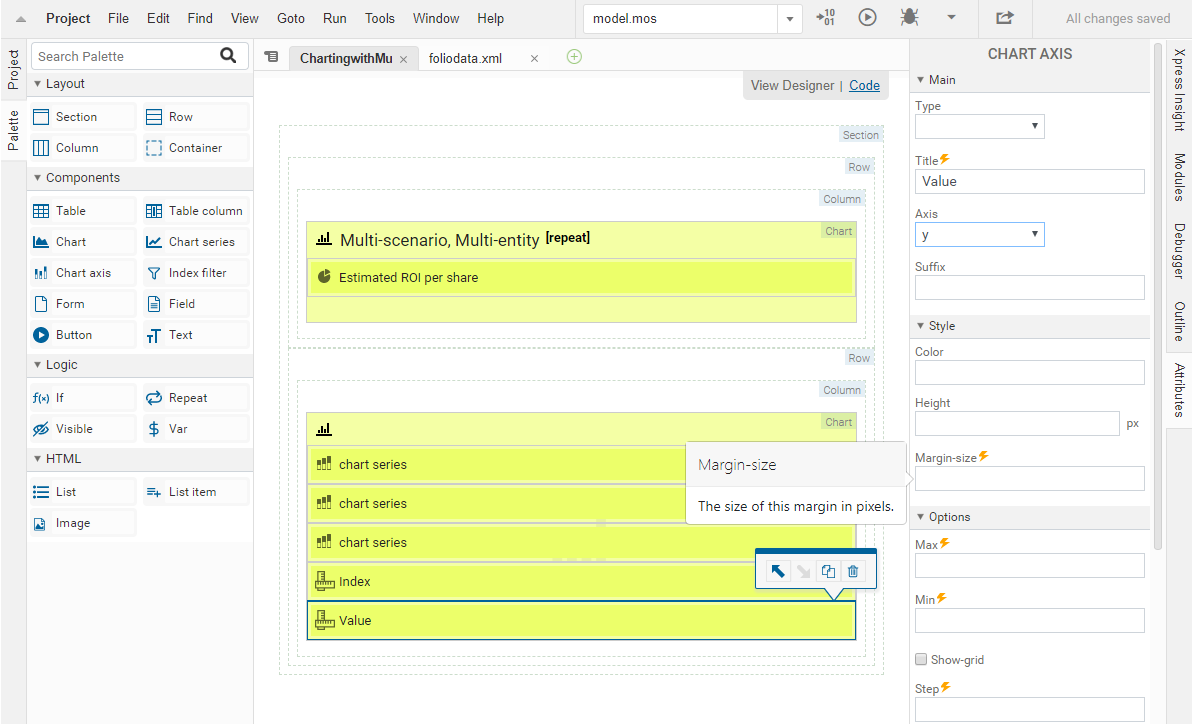
You can include additional detail to the vdl-chart, vdl-chart-axis, and the data attributes of vdl-chart-series elements.
View Designer
- Select x from the Axis drop down.
- Enter Index as the Title.
- Select y from the Axis drop down.
- Enter Value as the Title.
<vdl-chart id="test" title="The default chart type is a bar chart">
  <vdl-chart-axis axis="x" title="Index"></vdl-chart-axis>
  <vdl-chart-axis axis="y" title="Value" type="linear"></vdl-chart-axis>
  <vdl-chart-series data="=[10,3,20]" labels="First"></vdl-chart-series>
  <vdl-chart-series data="=[15,24,9]" labels="Second"></vdl-chart-series>
  <vdl-chart-series data="=[25,14,4,18]" labels="Third"></vdl-chart-series>
</vdl-chart>
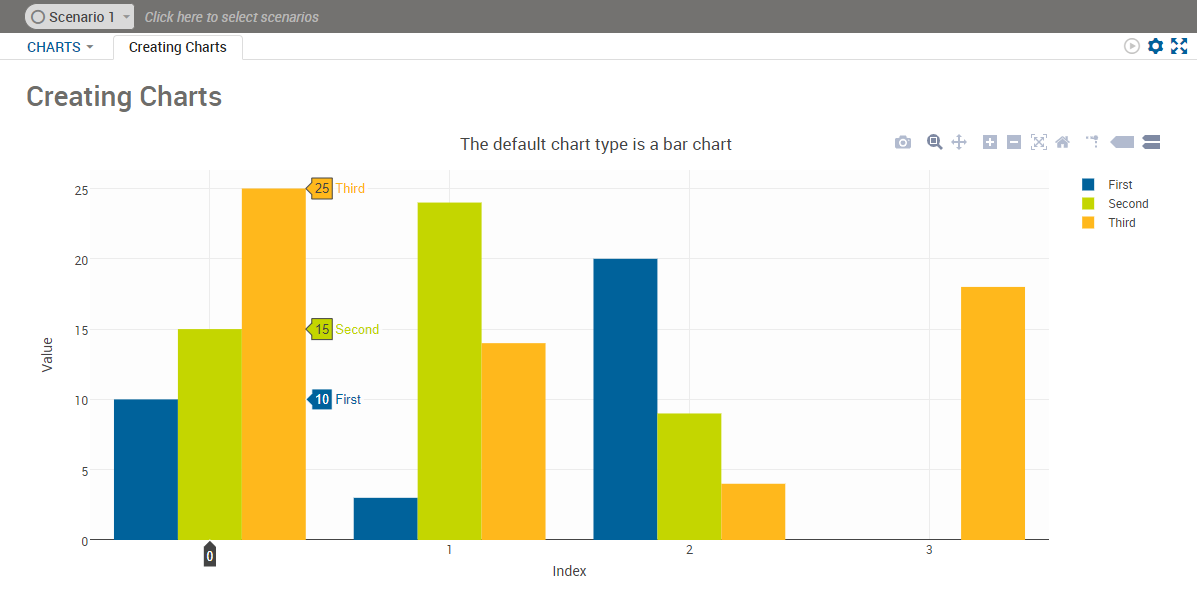
Simple Bar Chart
- vdl-chart is the container element for all charts. You can set a title for the chart with the title attribute.
- vdl-chart-axis allows you to define x and y axes for your chart via the axis attribute, to give your axes titles via the title attribute, and to specify the axis type with the type attribute.
- vdl-chart-series defines each independent set of data to be plotted on a chart. In the previous example, the data attribute is set to an expression that evaluates to a JavaScript array and the labels attribute designates the labels/legend for the series. The only exception to using multiple vdl-chart-series elements in a chart is with pie charts, where only one such element is permitted.
- In the View Designer, select the Bar Chart element and click the Bar mode attribute in the Attributes pane, select stack.
- In the code editor, include a bar-mode="stack" attribute within the vdl-chart element.
<vdl-chart bar-mode=”stack” title=”This is a stacked bar chart”>
  …
</vdl-chart>
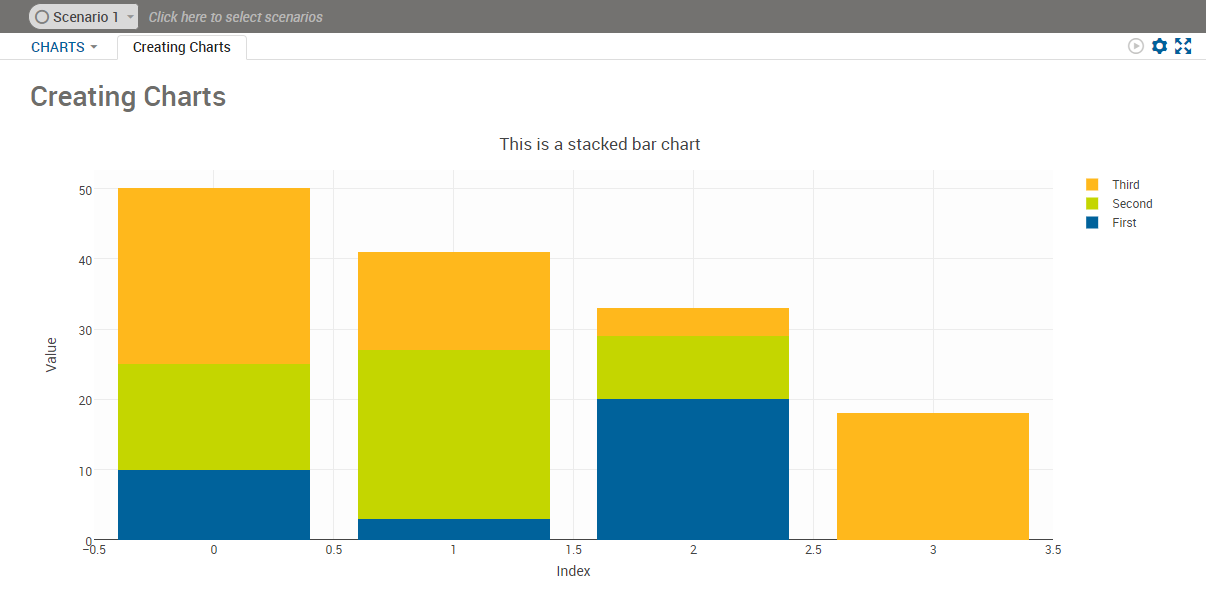
Stacked Bar Chart
© 2001-2020 Fair Isaac Corporation. All rights reserved. This documentation is the property of Fair Isaac Corporation (“FICO”). Receipt or possession of this documentation does not convey rights to disclose, reproduce, make derivative works, use, or allow others to use it except solely for internal evaluation purposes to determine whether to purchase a license to the software described in this documentation, or as otherwise set forth in a written software license agreement between you and FICO (or a FICO affiliate). Use of this documentation and the software described in it must conform strictly to the foregoing permitted uses, and no other use is permitted.