
Creating Charts
Bar Chart
In the View Designer
- In the SCENARIO COMPARISON column on the artboard, select the List item, and delete it.
-
In the Palette > Components group, click and drag the Chart element onto the SCENARIO COMPARISON column on the artboard. The Chart wizard is displayed.
- In the first page, select the data entities that the chart will plot—in this example, select Shares_fraction. Selected entities are highlighted in yellow, click a selected entity to de-select it. Click NEXT.
- In the second page, select the chart type—for this example, leave it at the default.
 Note Hover the cursor over the button in the corner of the chart type tiles to display a recommendation on when to use each chart type.
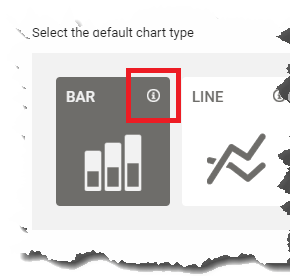
- The third window enables you to reorder the entities and change the data display type. If you select more than one data entity, you can use the arrows on the right of the window to change the position of a selected entity in the list.
-
Click FINISH.
- On the artboard, the chart type is indicated by the icon in the corner of the Chart element.
- The Chart Series element displays the alias that was assigned to the data series in the source file.
- In the Attributes pane, set the Title of the Chart to 'Recommended Shares'.
- Republish the scenario to see the results.
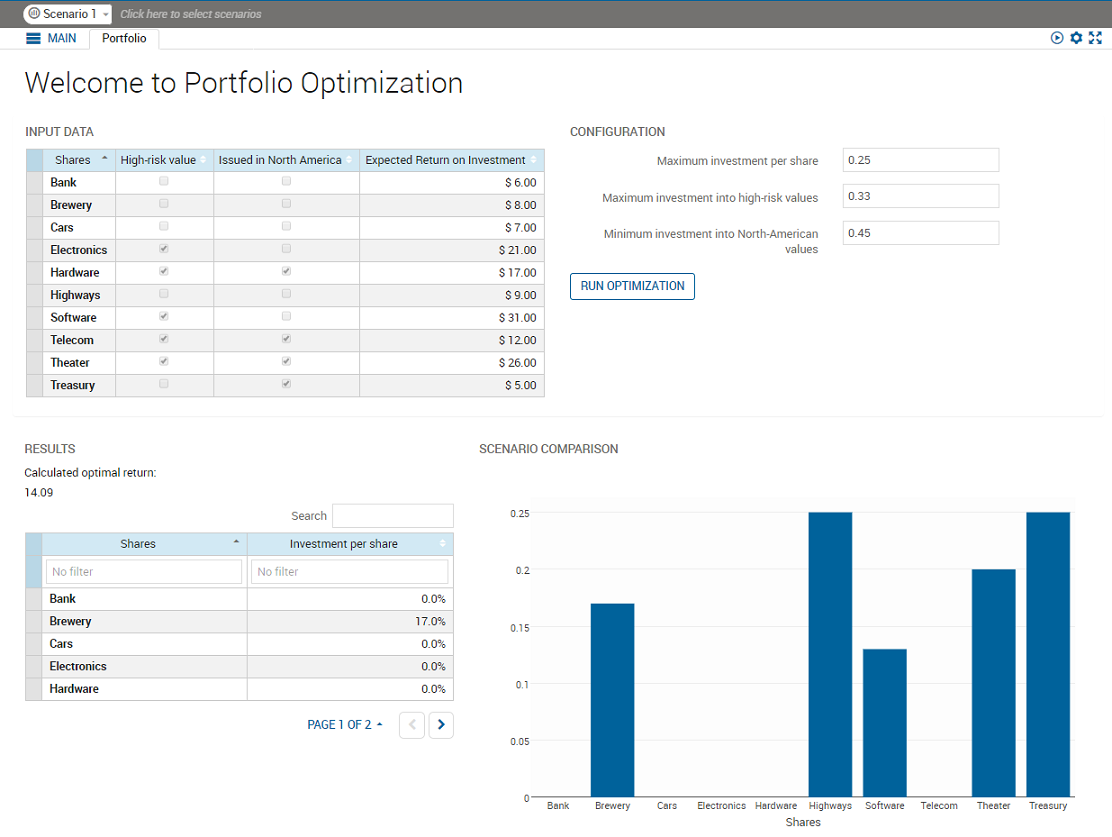
Bar Chart from the View Designer
Multi scenario bar chart
- In View Designer, on the artboard, select the Fraction used Chart Series. In the Attributes pane:
- In the field, enter =i.
- In the field, enter =s,i in scenarios.
- Republish the scenario to see the results. You will need to add a scenario and edit the data to see comparative results.
Stacked Bar Chart
You can convert this to a stacked bar chart.
- In the View Designer, select the Chart element on the artboard. In the Attributes pane:
- Set to stack.
- Republish the scenario. The figure shows the published application with three scenarios loaded.
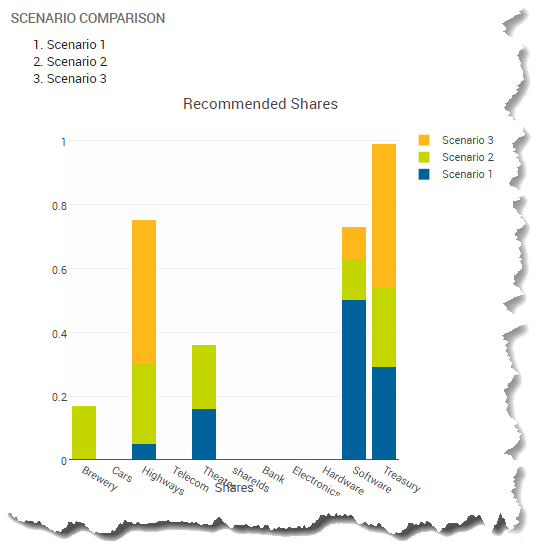
Stacked Bar Chart from the View Designer
Creating Pie Charts with Provided Data
Pie charts graphically represent sections of data as a proportion of a whole amount; Only one vdl-chart-series element is permitted for pie charts. In this example we can represent the amount invested in different share types in a pie chart.
To create a pie chart:
- On the artboard, select the Recommended Shares Chart element and delete it.
- In the Palette > Components group, click and drag the Chart element onto the Scenario Comparison Column. The Chart wizard is displayed.
- In the first window, select the data entities that the chart will plot—in this example, select Shares_fraction.
- In the second window, select the chart type—for this example, select Pie.
- Click FINISH.
- On the artboard, select the Chart. In the Attributes pane:
- In the field, enter =s,i in scenarios.
- On the artboard, select the Chart Series. In the Attributes pane:
- In the field, enter =i.
- Republish the scenario. The example renders as:
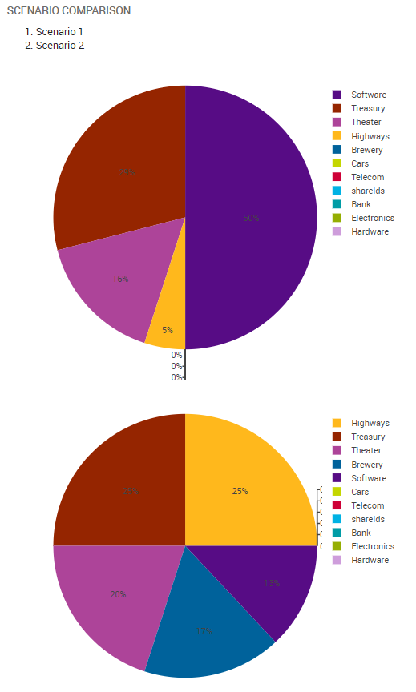
Pie Chart
© 2001-2020 Fair Isaac Corporation. All rights reserved. This documentation is the property of Fair Isaac Corporation (“FICO”). Receipt or possession of this documentation does not convey rights to disclose, reproduce, make derivative works, use, or allow others to use it except solely for internal evaluation purposes to determine whether to purchase a license to the software described in this documentation, or as otherwise set forth in a written software license agreement between you and FICO (or a FICO affiliate). Use of this documentation and the software described in it must conform strictly to the foregoing permitted uses, and no other use is permitted.