Drawing a user graph
We now have gathered all the data required to draw the graph. Graphing functions are provided by the module mmsvg (documented in the `Mosel Language Reference Manual'), so it needs to be loaded at the beginning of the model by adding the following line:
uses "mmsvg"
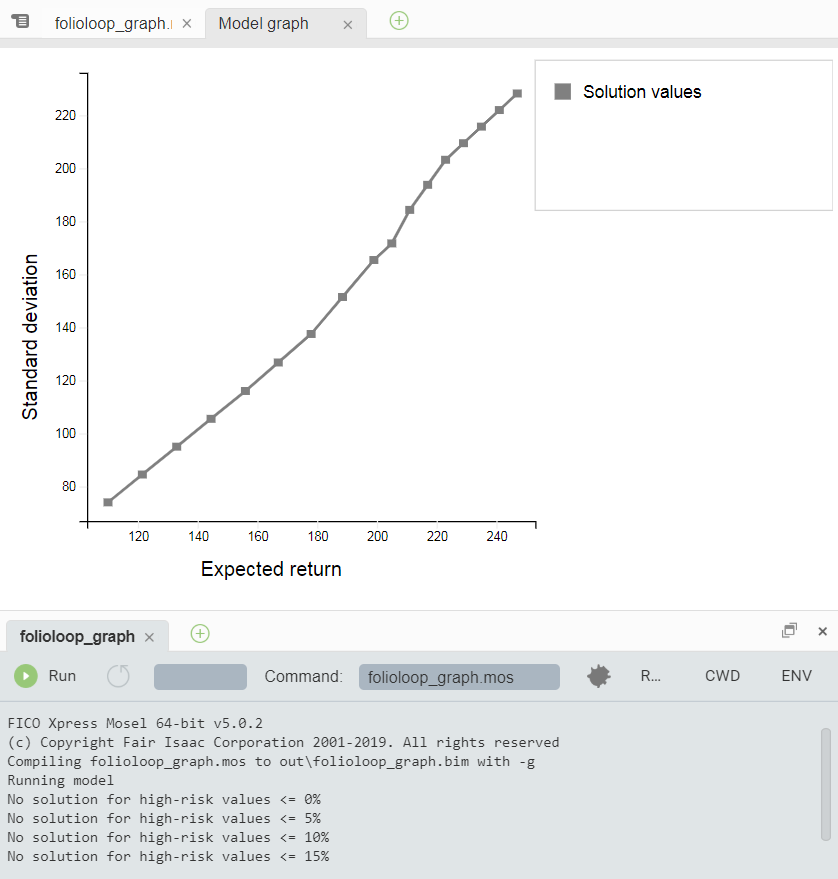
Then the following lines draw the graph (note the use of the sum operator to create a list of points):
 svgaddgroup("GrS", "Solution values", SVG_GREY)
 forall(r in 1..ct) svgaddpoint("GrS", SOLRET(r), SOLDEV(r))
 svgaddline("GrS", sum(r in 1..ct) [SOLRET(r), SOLDEV(r)])
The user graph will be displayed in the editor window of the Workbench workspace. Select the tab SVG drawing to move it to the foreground. With the above we obtain the following output (due to the interplay of the various constraints the resulting graph is not a straight line as one might have expected at first thought):

Figure 6.1: Plot of the result graph
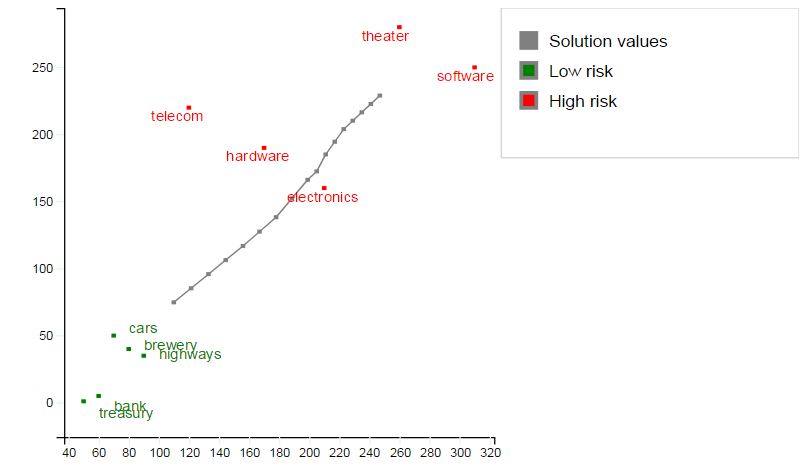
In addition to this graph, we may also display labeled points representing the input data (`GrL' for low risk shares and `GrH' for high risk shares):
 svgaddgroup("GrL", "Low risk", SVG_GREEN)
 svgaddgroup("GrH", "High risk", SVG_RED)

 forall(s in SHARES - RISK) do
  svgaddpoint("GrL", RET(s), DEV(s))
  svgaddtext("GrL", RET(s)+1, 1.3*(DEV(s)-1), s)
 end-do

 forall(s in RISK) do
  svgaddpoint("GrH", RET(s), DEV(s))
  svgaddtext("GrH", RET(s)-2.5, DEV(s)-1, s)
 end-do
Notice the set notation: SHARES - RISK means `all elements of SHARES that are not contained in RISK'.
The complete output now is:

Figure 6.2: Plot of result graph and data

