Creating Charts
The simplest chart to create is a bar chart (the default chart type) using provided static data.
View Designer
- In the Palette > Components group, click and drag the Chart element onto a Parent element. The Chart wizard is displayed. For this simple initial example, click FINISH.
-
To select the type of chart, add a Chart Series Component. In the Palette > Components group, click and drag the Chart Series element onto the Chart. Select the Chart Series element on the artboard.
- Edit the Attributes in the Attributes pane.
- Select bar(default) from the Type drop down.
-
In Data> Data, enter "=[10,3,20]".
- In the Palette > Components group, click and drag the Chart Series element onto the Chart. Select the Chart Series element on the artboard. Edit the Attributes in the Attributes pane.
- In Data > Data, enter "=[15,24,9]".
- In the Palette > Components group, click and drag the Chart Series element onto the Chart. Select the Chart Series element on the artboard. Edit the Attributes in the Attributes pane.
-
In Data > Data, enter "=[25,14,4,18]".
-
When published to Xpress Insight, this renders as:
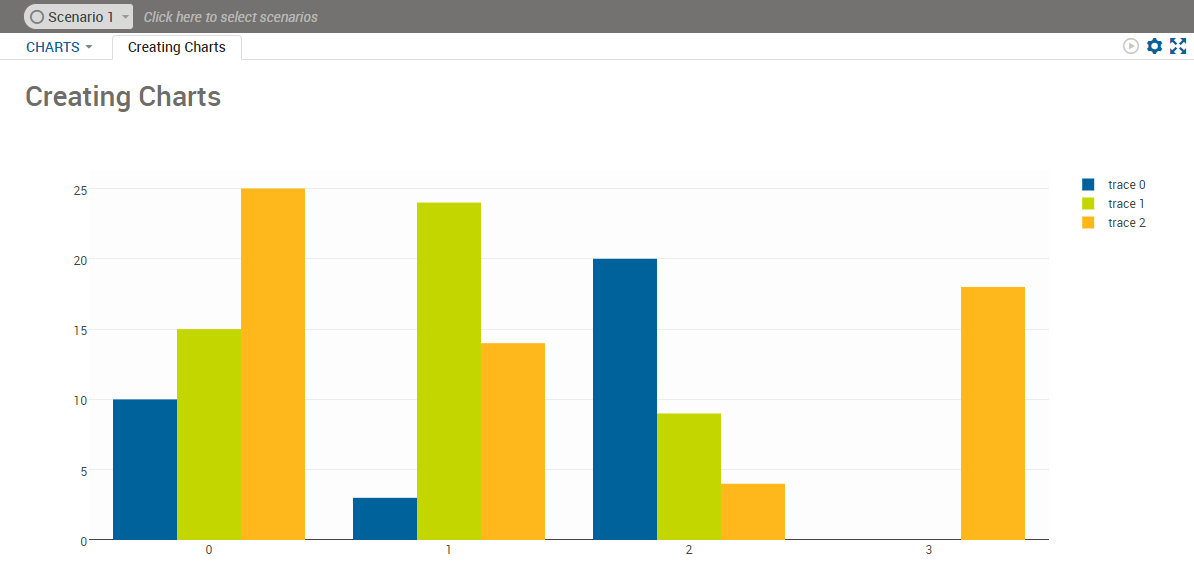
Bar Chart from the View Designer
You can include additional detail to the vdl-chart, vdl-chart-axis, and the data attributes of vdl-chart-series elements.
View Designer
In the
Palette >
Components group, click and drag the
Chart Axis element onto the
Chart. Select the
Chart Series element on the
artboard. Edit the
Attributes in the
Attributes pane.
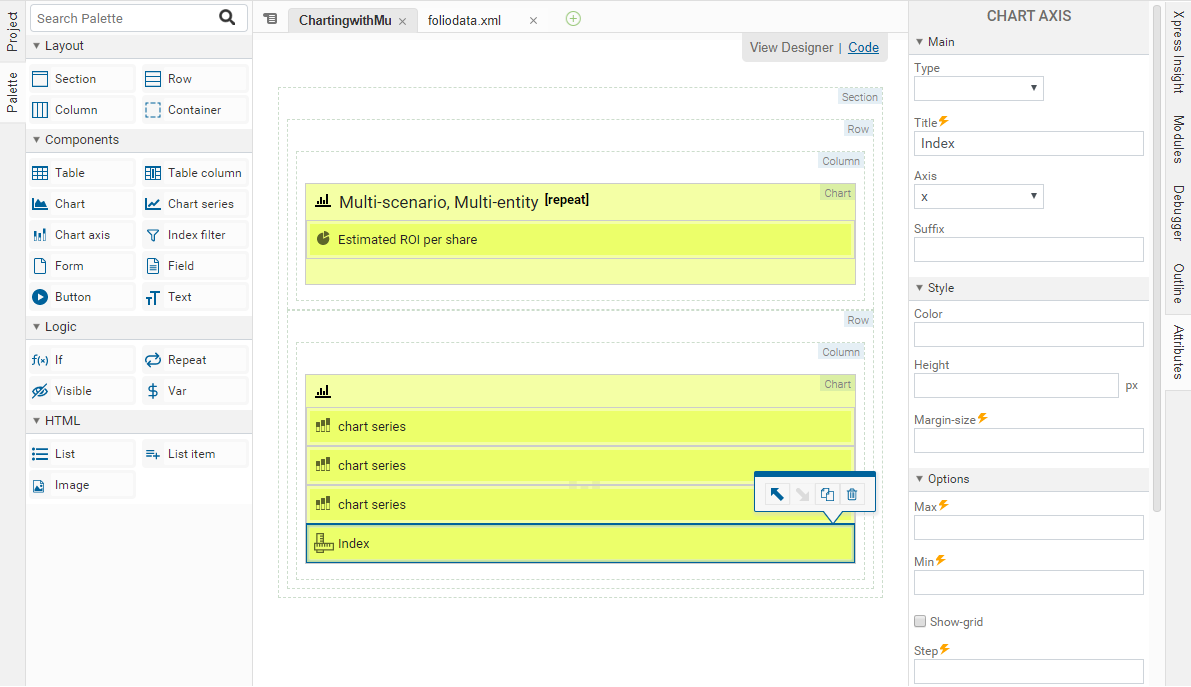
- Select x from the Axis drop down.
- Enter Index as the Title.

In the
Palette >
Components group, click and drag a second
Chart Axis element onto the
Chart. Select the
Chart Series element on the
artboard. Edit the
Attributes in the
Attributes pane.
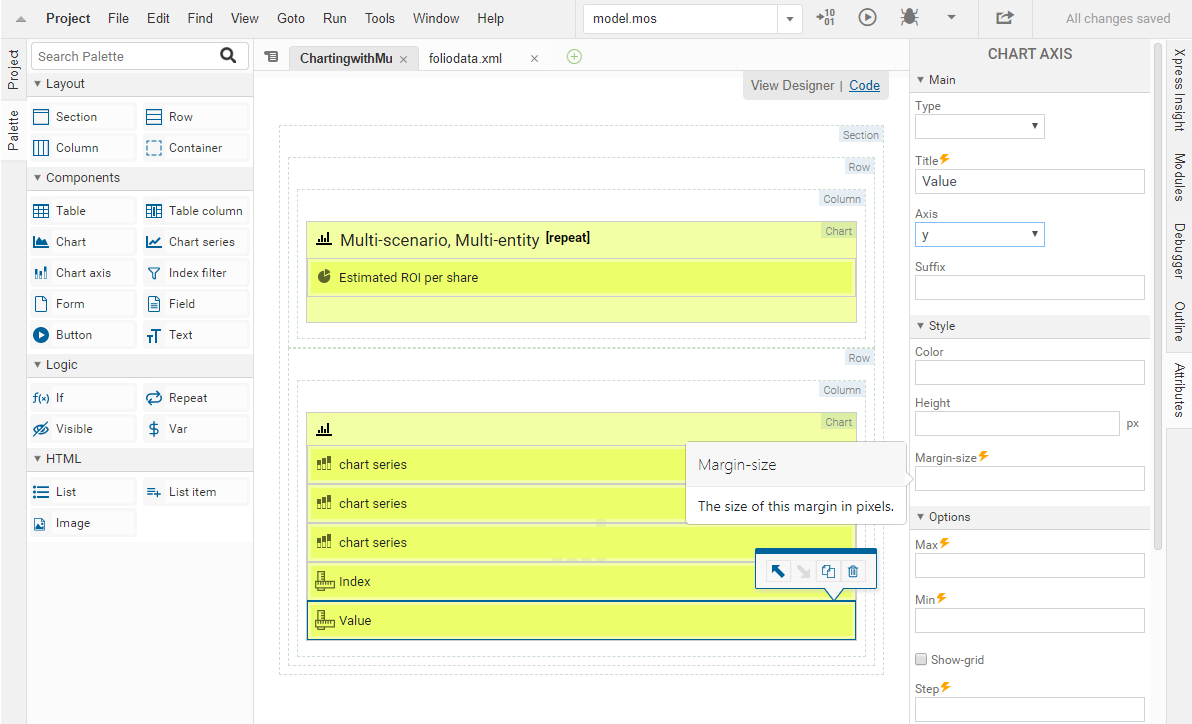
- Select y from the Axis drop down.
- Enter Value as the Title.

Code editor
<vdl-chart id="test" title="The default chart type is a bar chart">
  <vdl-chart-axis axis="x" title="Index"></vdl-chart-axis>
  <vdl-chart-axis axis="y" title="Value" type="linear"></vdl-chart-axis>
  <vdl-chart-series data="=[10,3,20]" labels="First"></vdl-chart-series>
  <vdl-chart-series data="=[15,24,9]" labels="Second"></vdl-chart-series>
  <vdl-chart-series data="=[25,14,4,18]" labels="Third"></vdl-chart-series>
</vdl-chart>
This renders as:
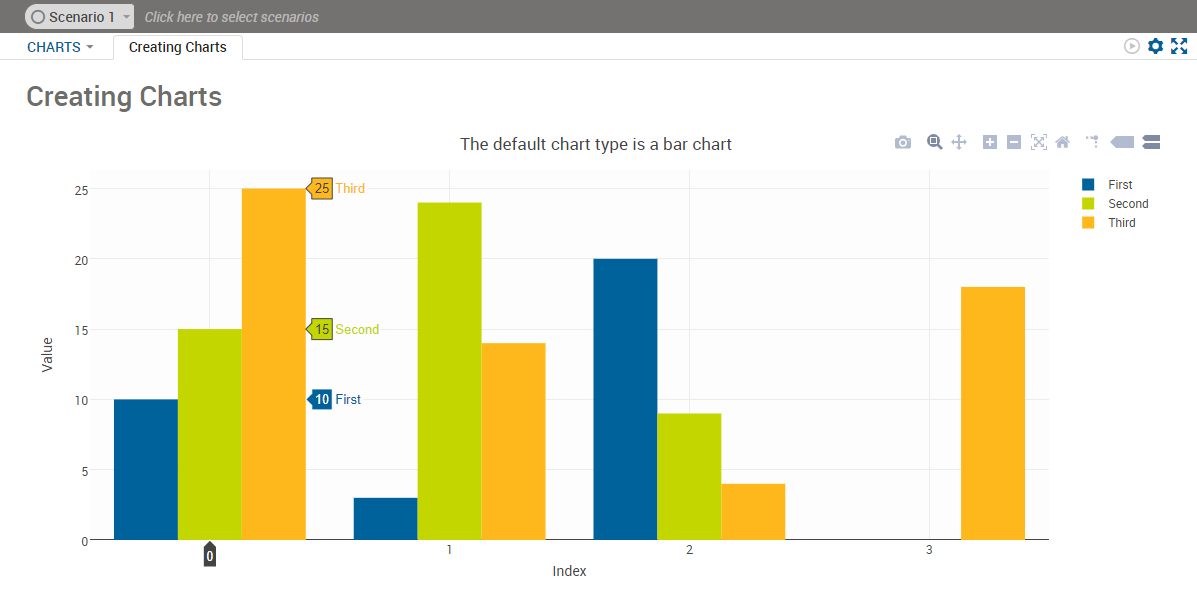

Simple Bar Chart
The significant tags are:
- vdl-chart is the container element for all charts. You can set a title for the chart with the title attribute.
- vdl-chart-axis allows you to define x and y axes for your chart via the axis attribute, to give your axes titles via the title attribute, and to specify the axis type with the type attribute.
- vdl-chart-series defines each independent set of data to be plotted on a chart. In the previous example, the data attribute is set to an expression that evaluates to a JavaScript array and the labels attribute designates the labels/legend for the series. The only exception to using multiple vdl-chart-series elements in a chart is with pie charts, where only one such element is permitted.
For stacked bar charts, either:
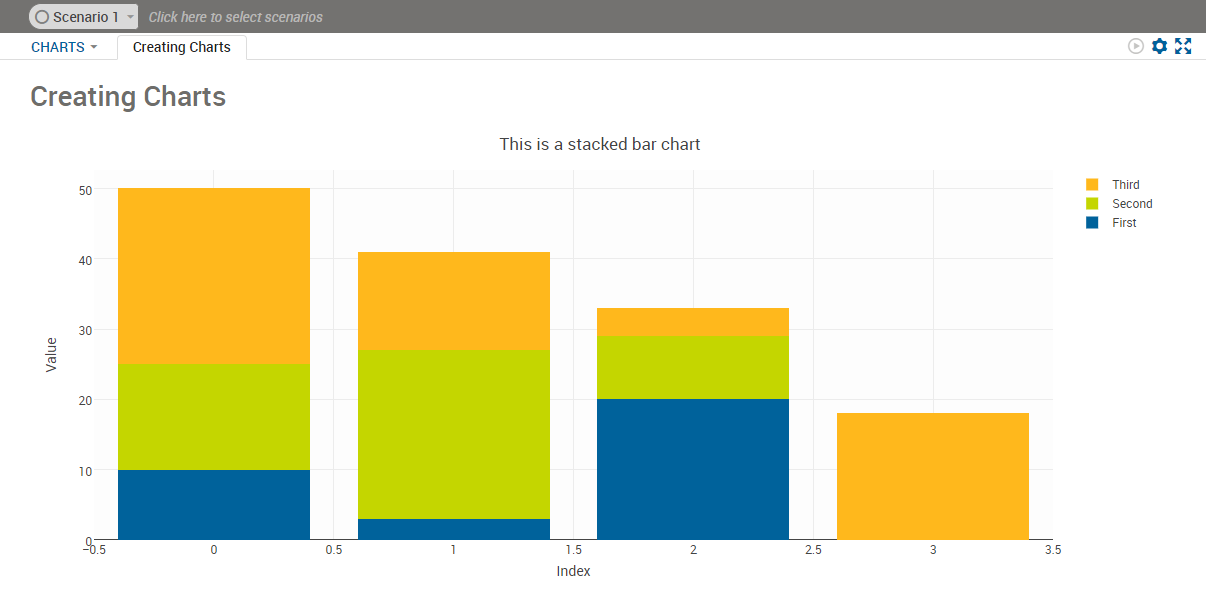
- In the View Designer, select the Bar Chart element and click the Bar mode attribute in the Attributes pane, select stack.
- In the code editor, include a bar-mode="stack" attribute within the vdl-chart element.
<vdl-chart bar-mode=”stack” title=”This is a stacked bar chart”>
  …
</vdl-chart>

Stacked Bar Chart

