Saves, compiles and begins/resumes debugging the current .mos (Mosel) model. While debugging, the execution will stop at breakpoints or can be controlled manually by stepping into the code. When the execution is interrupted, values for all identifiers (including those with a local scope) are available. Also, the Debug watches in the Info bar are updated.
Step over
While debugging, advance the execution point by one line, stepping over functions/procedure calls.
Step into
While debugging, advance the execution point by one line, stepping into functions/procedures.
Run to cursor
While debugging, run to the line where the editing cursor is positioned.
Debug Options...
Shows the Debug Options dialog for modifying the behavior of the debugger.
Profile
Saves, compiles and begins running the current .mos (Mosel) model. Every monitoring feature in IVE will be turned off to eliminate overheads; statistics will be gathered regarding time spent on every line of Mosel code. At the end of the run, the profiler output will be produced.

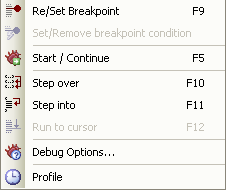
 Re/Set Breakpoint
 Set breakpoint condition
 Start/Continue
 Step over
 Step into
 Run to cursor
 Debug Options...
 Profile