
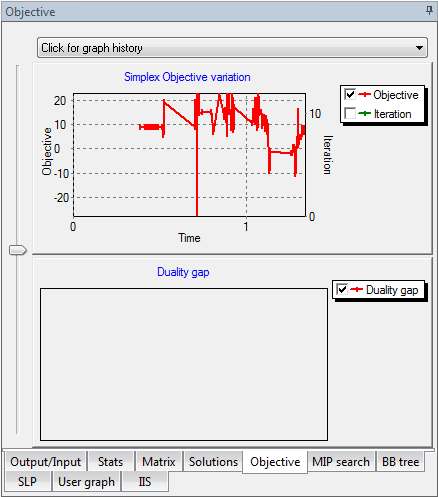
The Objective tab of the Run Bar
The graph on top shows the evolution in time of the objective value during the Simplex algorithm. The iteration is also plotted by time.
The graph at the bottom shows the evolution in time of the duality gap during the Newton barrier algorithm.
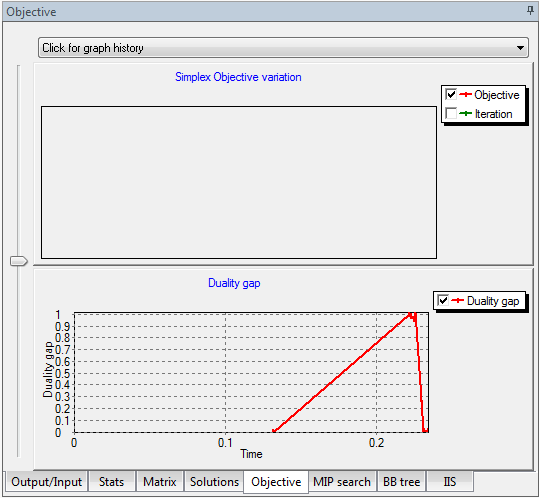
- At any time, only one of these progress graphs can be active (corresponding to the algorithm currently running).
- The graphs can be zoomed in and out and each curve can be shown or hidden using the checkboxes in the graph legend.
- Use the slider bar to change the vertical size of either graph.
- Xpress-IVE maintains a history of the last ten graphs produced. Select the desired graph from the list at the top. Note that the graph history cannot be accessed during an optimization.