
The User graph tab of the Run Bar
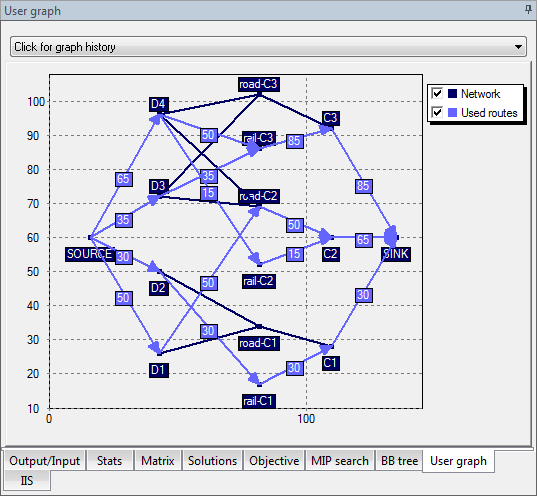
This window offers the opportunity to plot points on an unlimited two-dimensional grid when using the "mmive" Mosel library. The graph is automatically scaled to include all and only the plotted points. There is no limit on the number of items that can be plotted.
The "mmive" module in Mosel contains these functions and procedures:
- procedure IVEpause( message: string)
- Pauses the Mosel execution at the line where it was called. It also prints a message at the top of the Run Bar that may inform the user of the reason for pausing. While the execution is paused, model entities can be examined in the entity tree, or the user graph may be inspected in slow motion.
- function IVE_RGB( red: integer, green: integer, blue: integer): integer
- Compute a composite color by combining amounts of red, green and blue.
- function IVEaddplot(name:string, color:integer): integer
- Inserts a new plot on the user graph. A plot is indentified by its name and can be shown or hidden using its corresponding legend checkbox. The maximum number of distinct plots is currently limited to 20. However, each plot can contain an unlimited number of points, lines, arrows and labels. In the graph above, both "first fractal" and "second fractal" are plots. They can be shown/hidden using the checkboxes in the legend.
- procedure IVEdrawarrow(handle:integer, x1:real, y1:real, x2:real, y2:real)
- Add an arrow to an existing plot. The arrow connects the two points whose coordinates are given as parameters, pointing to the second one.
- procedure IVEdrawlabel(handle:integer, x:real, y:real, text:string)
- Add a text box to an existing plot. The box will be centered horizontally just above the point given.
- procedure IVEdrawline(handle:integer, x1:real, y1:real, x2:real, y2:real)
- Add a line to an existing plot. The line connects the two points whose coordinates are given as parameters.
- procedure IVEdrawpoint(handle:integer, x:real, y:real)
- Add a small square to mark a point at the given coordinates.
- procedure IVEerase
- Remove all plots and reset the user graph.
- procedure IVEzoom(x1:real, y1:real, x2:real, y2:real)
- Scales the user graph. The viewable area is determined by its lower left and upper right corners.