
Configuring Chart Axes
The vdl-chart-axis element has several possible attributes:
These settings can be configured in the View designer and in the code editor.
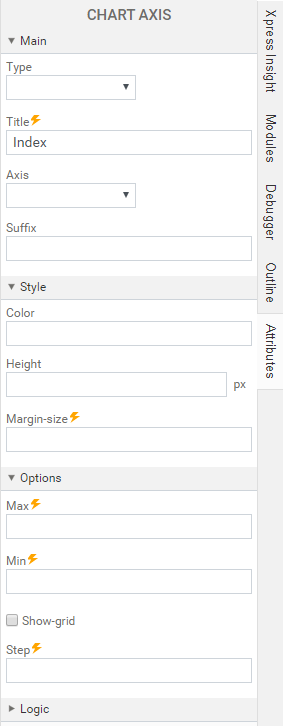
View Designer Attributes pane
Code editor
- axis is a string value that can be set to x or y.
- min is the minimum bound for the axis, that must be specified if you are using the max attribute.
- max is the maximum bound for the axis, that must be specified if you are using the min attribute.
- step is the step increment for the axis.
- unit is the unit for the axis (code editor only).
- type is a string that can be set to linear, log, date or category (default unless all series are of type scatter/line, when it defaults to linear).
- title is a string used as a title for an axis, which can be a dynamic expression.
- show-grid is a boolean, defaulting to true, which controls whether a background grid is rendered. This can also be the result of a dynamic expression.
Using these attributes, a chart can be defined as:
<vdl-chart>
<vdl-chart-axis axis="x" min="0" max="100" step="20" units="cm" type="category"></vdl-chart-axis>
<vdl-chart-axis axis="y" min="0" max="100" step="20" units="cm" type="category"></vdl-chart-axis>
</vdl-chart>