
Creating Line Charts, Scatter Plots and Pie Charts with Provided Data
All the other chart types can be created from variations of the above examples, noting that the respective vdl-chart-series elements will need a type attribute in anything other than a default bar chart, and that only one vdl-chart-series element is permitted for pie charts.
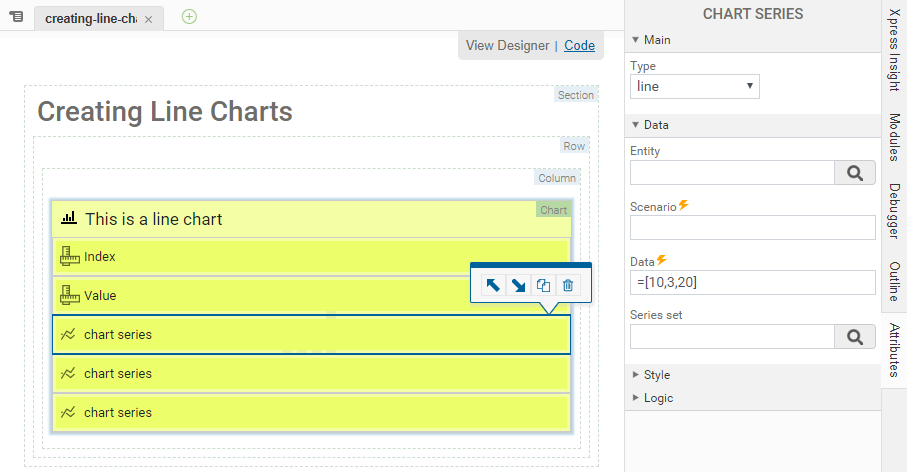
To create a line chart:
View Designer
-
Select the Chart Series element on the artboard.
-
Edit the Attributes in the Attributes pane.
- Select line from the Type drop down. Note that the icon on the Chart Series artboard element updates.
Code editor
<vdl-chart title=”This is a line chart”>
<vdl-chart-axis axis="x" title="Index"></vdl-chart-axis>
<vdl-chart-axis axis="y" title="Value" type="linear">
</vdl-chart-axis>
<vdl-chart-series data="=[10,3,20]" type=”line” labels="First">
</vdl-chart-series>
<vdl-chart-series data="=[15,24,9]" type="line" labels="Second">
</vdl-chart-series>
<vdl-chart-series data="=[25,14,4,18]" type="line" labels="Third">
</vdl-chart-series>
</vdl-chart>
Note the
type=”line” attribute on the
vdl-chart-series elements. This renders as:
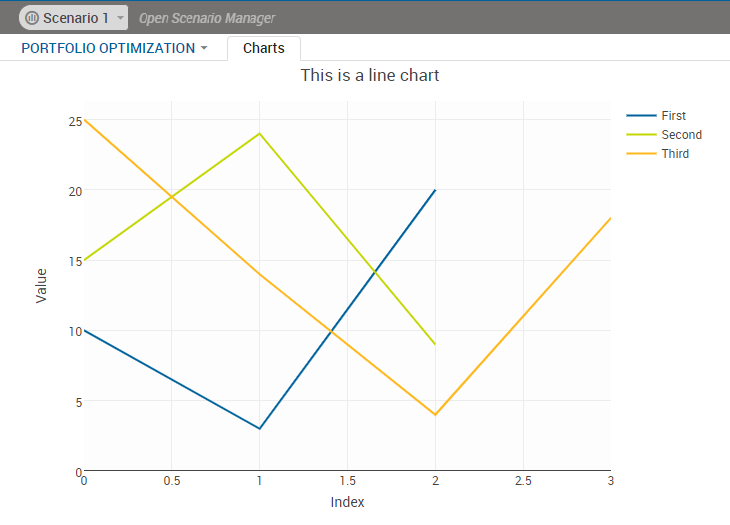
Line Chart
Use type=”scatter” and type=”pie” for scatter plots and pie charts respectively.
Note that in addition to accepting just one series, pie charts can accept a data attribute containing an expression assigning keys and values, whereby the keys become the off-chart legends:
View Designer
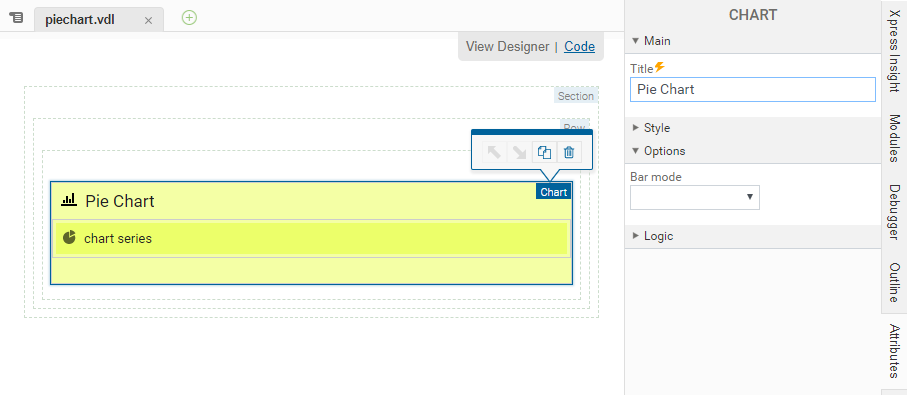
Code editor
<vdl-chart title=”Pie Chart”>
  <vdl-chart-series data="={keys: ['good', 'better', 'best'],
                    values: [19, 26, 55]}" type="pie" >
  </vdl-chart-series>
</vdl-chart>
Which renders as:
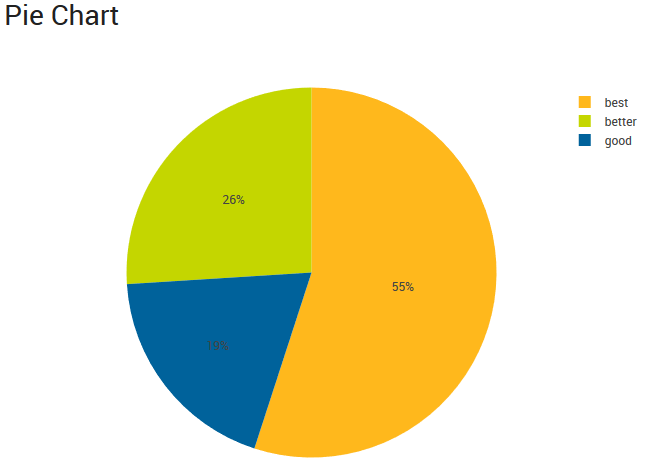
Pie Chart