Alerting
StatefulSet named alertmanager-main, running in the dmp-monitoring namespace.
However, there are no standard receivers. By default, incoming alerts are forwarded to nowhere. You can implement your own receivers as described in the Prometheus documentation. For more. see https://prometheus.io/docs/alerting/overview/.
Grafana Dashboards
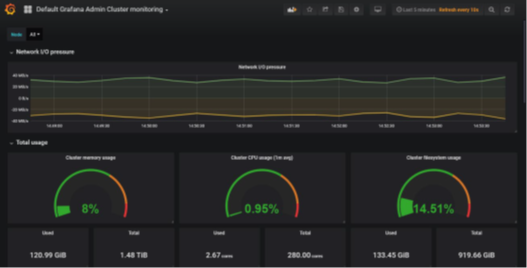
Authorized users can access Grafana at https://grafana.<hosted_zone_name>. By default a single dashboard is included, named Default Grafana Admin Cluster monitoring.

© 2001-2022 Fair Isaac Corporation. All rights reserved. This documentation is the property of Fair Isaac Corporation (“FICO”). Receipt or possession of this documentation does not convey rights to disclose, reproduce, make derivative works, use, or allow others to use it except solely for internal evaluation purposes to determine whether to purchase a license to the software described in this documentation, or as otherwise set forth in a written software license agreement between you and FICO (or a FICO affiliate). Use of this documentation and the software described in it must conform strictly to the foregoing permitted uses, and no other use is permitted.

