
Verifying the Installation
- Click on Health Check on the left-hand navigation.
The health test can take up to a minute to complete, during which time a spinner is displayed. On completion, a test report is displayed. Both Mirror and Tableau sections should show an overall status of PASS.
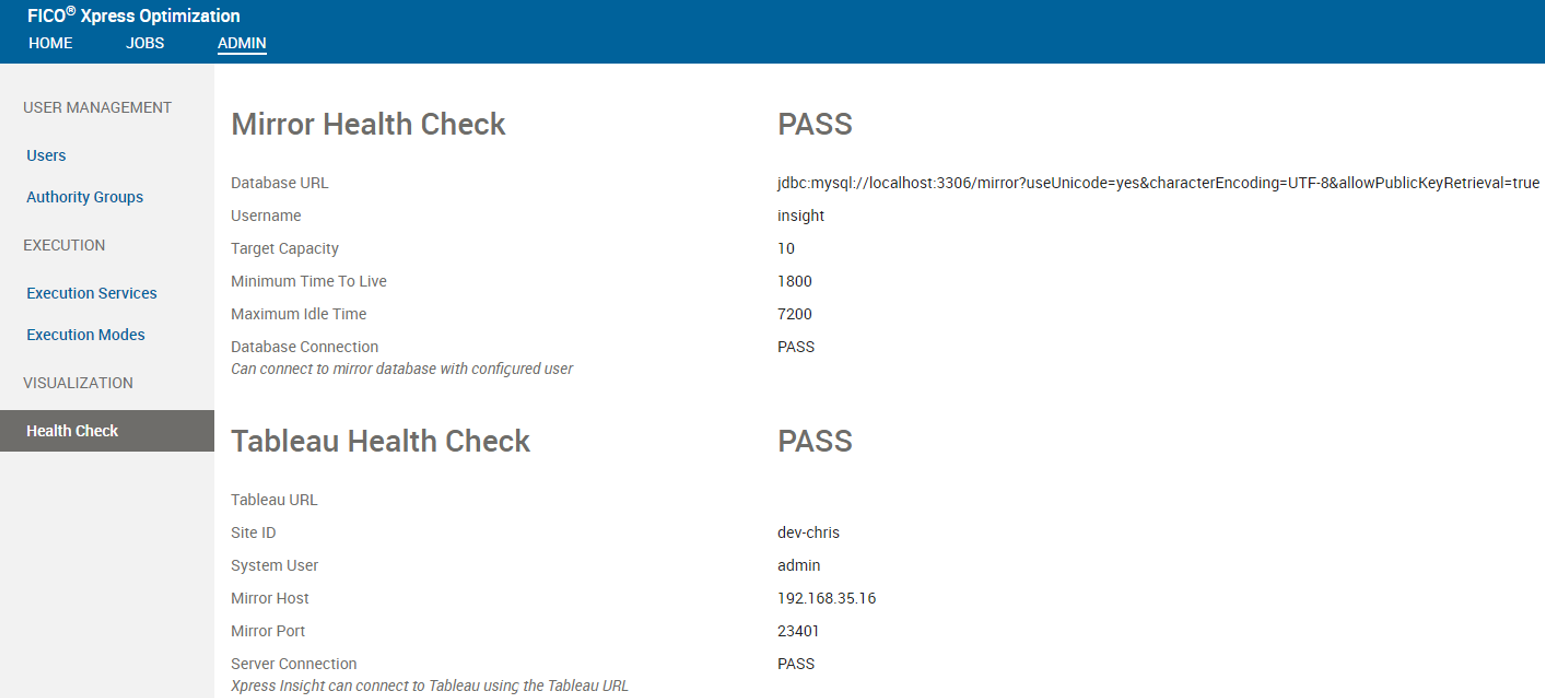
The Health Check can verify the connectivity between Insight and Tableau but not between Tableau and the MySQL mirror. To verify the complete end to end integration, we recommend uploading an example app to confirm that a Tableau visualization is successfully rendered.
The following steps are for the Flowshop demo example app in the Insight Developer Kit. Download this from the same location that you acquired the Insight software installer itself and unzip it to your local machine. The instructions will upload the app and then open a Tableau view for a scenario with results data.
© 2001-2023 Fair Isaac Corporation. All rights reserved. This documentation is the property of Fair Isaac Corporation (“FICO”). Receipt or possession of this documentation does not convey rights to disclose, reproduce, make derivative works, use, or allow others to use it except solely for internal evaluation purposes to determine whether to purchase a license to the software described in this documentation, or as otherwise set forth in a written software license agreement between you and FICO (or a FICO affiliate). Use of this documentation and the software described in it must conform strictly to the foregoing permitted uses, and no other use is permitted.