
Tutorial: Building your First Tableau View
-
A development installation of Insight 5.4 or later which has been integrated with Tableau Server. See Integrating Xpress Insight with Tableau for more information.
- An installation of Workbench 3.7 or later for editing the app project.
- An installation of Tableau Desktop for authoring a Tableau workbook.
- User accounts for Insight and Tableau Server with matching usernames.
- A working knowledge of Insight app development and deployment.
- A basic knowledge of Tableau authoring. Learning material can be found in Learning area of
- Defining the data for the visualization
- Adding the Tableau VDL component to the view
- Creating the Tableau workbook
- Designing the visualization
- Completing the view
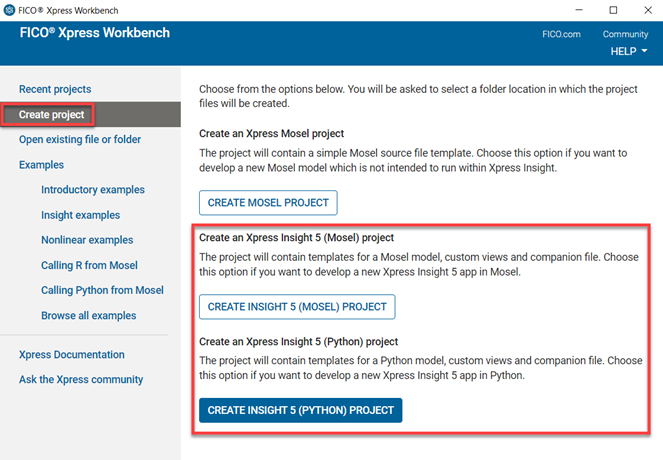
- Open Xpress Workbench and create a new Mosel or Python Insight project.
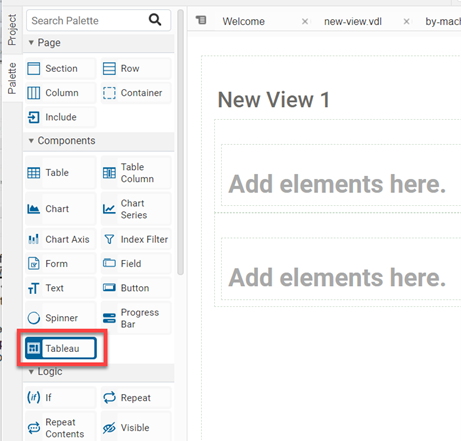
- Add a Tableau component to the new view by dragging the Tableau component from the palette into a column element.
This component embeds a Tableau visualization that will be created later.
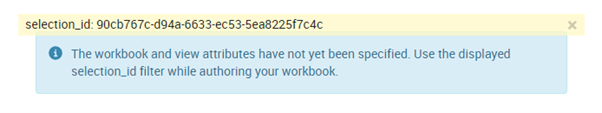
- The Tableau component will display an id. This is the selection id. The component displays this id when it is not yet configured with a workbook and view. The id will be used to filter the data in Tableau desktop to only the data relating to the scenarios we have selected on the shelf. You will need the selection id later in this tutorial. Leave this Insight view open in the browser. The data will be cached in the mirror database and available to Tableau Desktop for as long as the view is open.
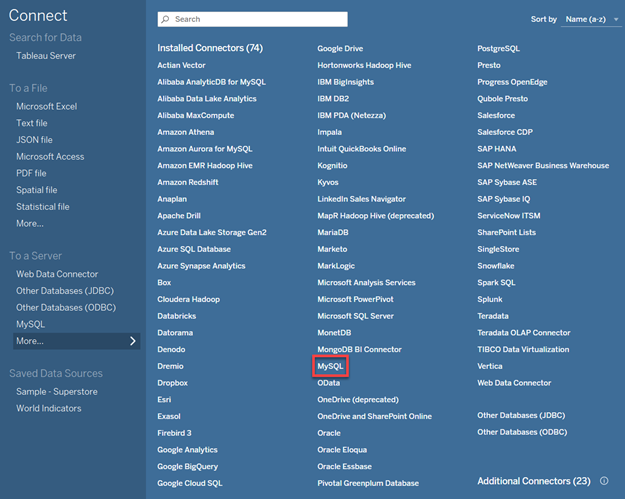
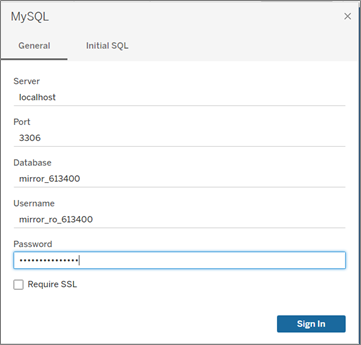
- Click on , then choose MySQL as shown below. MySQL is used as a data connection between the Tableau workbook and the mirror database.
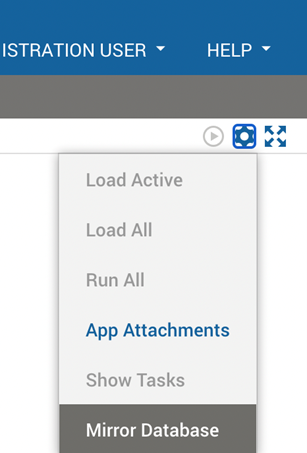
- Tableau Desktop needs the app-specific credentials of the mirror database to access the scenario data. This information is available from the user interface in Insight. In the app, go to the cogs menu next to the shelf and choose the Mirror Database option.
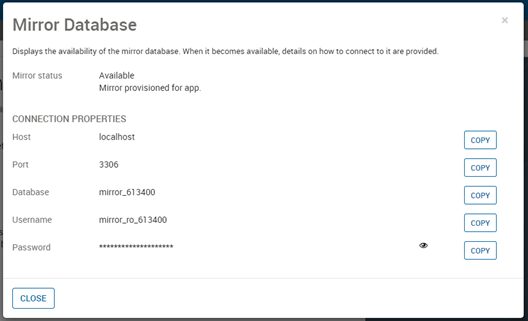
- Copy the mirror database connection properties from the Insight dialog to the Tableau Desktop MySQL connection dialog.
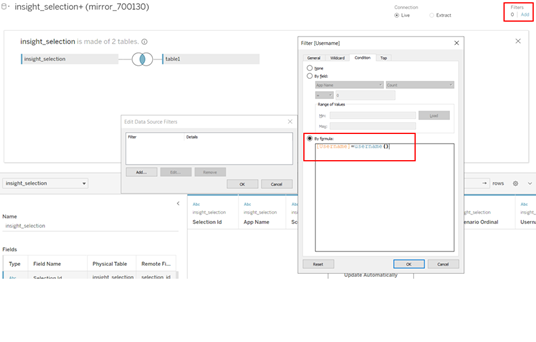
- Define a data source which uses the scenario data tables required by the workbook design. Any data tables must be joined to the insight_selection table to select the correct data. Drag the insight_selection table onto the canvas and double-click on the insight_selection box. Drag table1 and place it to the side (not on top) of the insight_selection box. The tables are now joined and should appear as shown below:
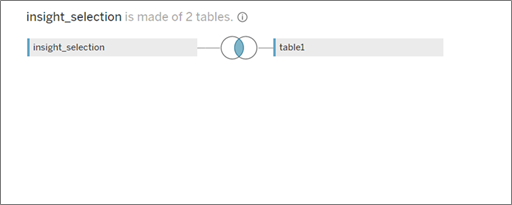
 Important: Do not connect the tables on the first logical layer using a relationship. It is important to double-click on the insight_selection box and then create a physical join for performance reasons. See The Tableau Data Model.
 - The data source requires a filter on username to implement the Insight user access model. This ensures that the currently authenticated username must match the username of the Tableau view requestor. In the top-right of the Tableau Desktop interface, click on Add under the filters caption. Click Add again on the Edit Data Source Filters dialog. Select username from the list. Switch to the Conditions tab and select by formula and enter [Username]=username(). Click OK to close the dialogs.
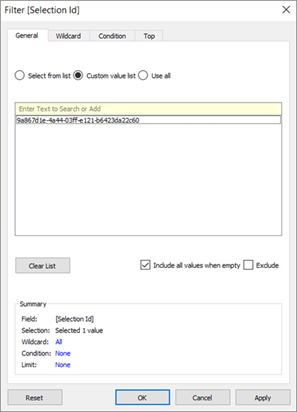
- To ensure the sheet is working with your selected scenario data during development, set the Selection Id filter to the id value displayed by the Insight view in Step 9. You can set the filter value either by picking the value from the list of possible values for the filter or by entering it as a custom value.
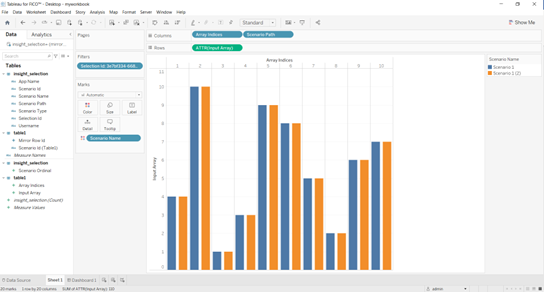
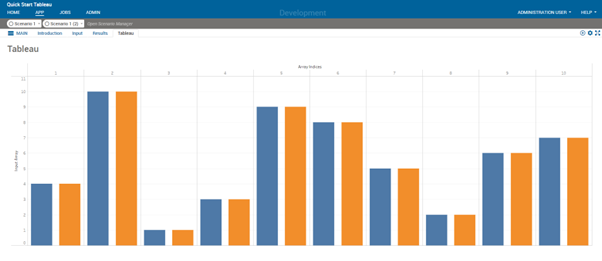
- To add a bar chart of Input value by interval across all scenarios, drag Array Indices and Scenario Path to the Columns shelf and ensure that they are configured as discrete dimensions (click on the pills to view the configuration). Drag Input Array to the Rows shelf and ensure that it is configured as an attribute. Drag Scenario Name to the Marks panel.
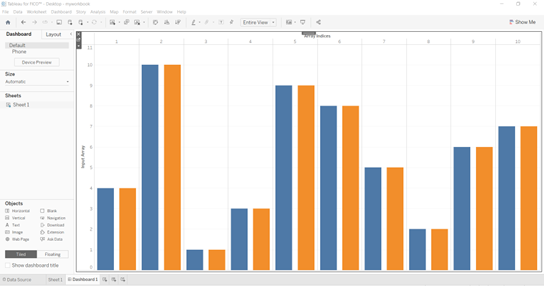
- Right-click on the area below the x axis and turn off the axis headers. Your dashboard should appear as shown below:
- Open the view in Insight to verify that it is displaying correctly.
© 2001-2024 Fair Isaac Corporation. All rights reserved. This documentation is the property of Fair Isaac Corporation (“FICO”). Receipt or possession of this documentation does not convey rights to disclose, reproduce, make derivative works, use, or allow others to use it except solely for internal evaluation purposes to determine whether to purchase a license to the software described in this documentation, or as otherwise set forth in a written software license agreement between you and FICO (or a FICO affiliate). Use of this documentation and the software described in it must conform strictly to the foregoing permitted uses, and no other use is permitted.