
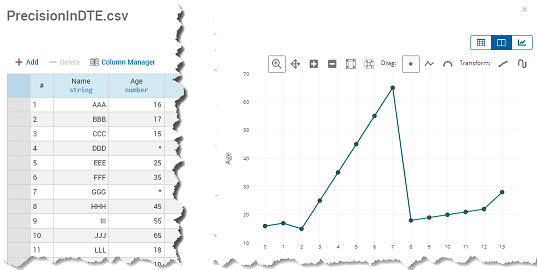
Editing the Data Points
Data displayed on the chart can be directly edited in the table view, or can be manipulated graphically on the chart view by dragging points or applying straighten or smoothing algorithms.

|
Note: The edited cell value is only updated in the table when you deselect the cell. You can then save the new values to the database using the
SAVE button.
|
The scale of the displayed Y-axis will adjust to accommodate the new data point value if necessary.
Drag Tools
Points on the chart view can be moved either by clicking and dragging with the mouse, or by pressing the up and down arrows on your keyboard. The tool that you select in the Drag menu determines the value or range of values that are affected.
| Icon | Description |
|---|---|
 |
Drag the selected point |
 |
Drag the series containing the selected value |
 |
Drag a point on the series to create a curve between the first and last values in a selected series.
Note: When you drag to create a curve, the beginning and end point values in the series do not change. If you select an end point and try to drag a curve, the center point will be used.
|
Transform Tools
Select a point on the plotted series in the Chart View and use the Transform options to apply an algorithmic adjustment to the selected series.
| Icon | Description |
|---|---|
 |
Straighten the points between the first and last values in a selected series |
 |
Smooth the points between the first and last values in a selected series |
|
|
Note: The Smooth tool uses the least square fitting polynomial of up to three degrees. Polynomials of a higher order are subject to a small penalty.
|
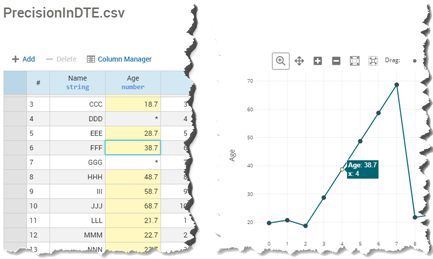
Precision When Dragging
When dragging a selection in the chart editor, the precision on data displayed in in the table is increased by one decimal place to provide a finer degree of control. This precision is persisted when saving the data, and so will increase on each load for the same data. Therefore, each time you open the Decision Table Editor, edit the chart using drag mode, and close the Editor, you will increment the level of precision. The image below shows the values in the data table before and after the series has been dragged to a new position.
| Before Editing the Chart Series |
 |
| After Editing the Chart Series |
 |
© 2001-2024 Fair Isaac Corporation. All rights reserved. This documentation is the property of Fair Isaac Corporation (“FICO”). Receipt or possession of this documentation does not convey rights to disclose, reproduce, make derivative works, use, or allow others to use it except solely for internal evaluation purposes to determine whether to purchase a license to the software described in this documentation, or as otherwise set forth in a written software license agreement between you and FICO (or a FICO affiliate). Use of this documentation and the software described in it must conform strictly to the foregoing permitted uses, and no other use is permitted.