
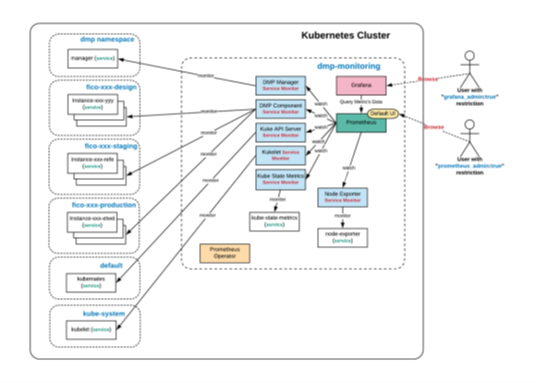
Prometheus Metrics
- Service Monitors for the Kubernetes cluster. Prometheus Node Exporter exposes a wide variety of hardware- and kernel-related metrics.
- The Kubernetes kube-state-metrics add-on agent Generates and exposes cluster-level metrics.
- Kube API Server exposes Prometheus metrics by default.
- Kubelet exposes Prometheus metrics by default.
© 2001-2025 Fair Isaac Corporation. All rights reserved. This documentation is the property of Fair Isaac Corporation (“FICO”). Receipt or possession of this documentation does not convey rights to disclose, reproduce, make derivative works, use, or allow others to use it except solely for internal evaluation purposes to determine whether to purchase a license to the software described in this documentation, or as otherwise set forth in a written software license agreement between you and FICO (or a FICO affiliate). Use of this documentation and the software described in it must conform strictly to the foregoing permitted uses, and no other use is permitted.