
Log Monitoring with the Insight Component
- kubectl provides access to logs exposed by the Kubernetes pods that implement the components.
- DMP Manager provides access to the logs produced by web-service components, and to solution logs produced by DMP Manager itself.
kubectl
The kubectl logs command provides interactive access to the logs for each k8s pod. Each pod can be identified through the labels and the namespace associated with the pod.
K8s Configmaps
Logs for the Xpress Workbench components can be configured by k8s configmaps. These will be normally be left unedited on the default configuration.
- trace
- debug
- info
- warn
- error
- fatal

|
Note: You should not enable
debug or higher levels of logging during day-to-day operations.
|
Kubernetes configmaps are used to change the level of logging adopted by Xpress Workbench in the DMPp environment. They should not be used unless so instructed by Technical Support. Incorrect configuration could severely impair the performance of your installation.
| Configmap | xw-logging-level-<instanceId> |
| Log Identifier | WORKBENCH_LOGGING |
| Description | Covers logging in most areas on Workbench |
| Usage | The Can be set using the kubectl command-line tool with option |
| Configmap | xw-mosel-runner-logging-level-<instanceId> |
| Log Identifier | MOSEL_RUNNER_LOGGING |
| Description | Covers logging related to use of Mosel (compiling, debugging, etc) and it communication with Insight servers |
| Usage | The Can be set using the kubectl command-line tool with option |
| Configmap | xw-custom-logging-levels-<instanceId |
| Log Identifier | Each key/value pair in the WORKBENCH_LOGGING_<key_name>
Note: Subsystem names are intentionally not listed publicly
|
| Description | For selective overriding of general Workbench logging level |
| Usage |
The
configmap should have each key/value pair linking a subsystem and its respective logging levels
Note: These values can be specified for the kubectl tool in an env file: each line is a
key=value setting
This can be used with the kubectl command via the |
Access the k8s logs
kubectl -n globaltenantid-production get pods -l com.fico.dmp/componentId=pbdeugpf9NAME READY STATUS RESTARTS AGE
instance-5waipvh71z-7dbb9bdf77-cf7sr 1/1 Running 0 6d20h
instance-5waipvh71z-7dbb9bdf77-pxzb4 1/1 Running 0 7d1h
kubectl -n globaltenantid-production log instance-5waipvh71z-7dbb9bdf77-cf7srFICO® Platform Manager
https://manager. <hosted_zone_name>/com.fico.dmp.manager/From the Components tab, you see a table listing all of the components that are owned by the signed-in user. The FICO® Platform Admin user can also see all of the current components. In the far-right column of each table row there is a pencil icon. Click it to access information about the component, as well as the component logs.
- Component Logs — For most components this is the Catalina log for the web application.
- FICO® Platform Manager Logs — These are the log entries produced by FICO® Platform Manager during lifecycle operations on the component.
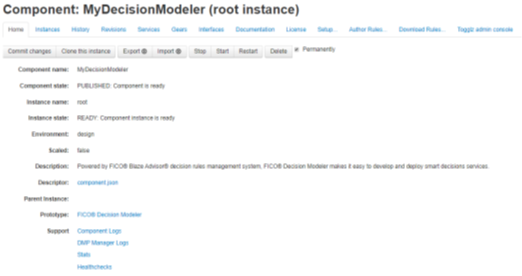
Click the pencil icon on the far right of each entry to access information, including logs, for each instance.
Solution Logs
From the Solutions tab, you see a table listing all of the solutions that are owned by the signed-in user. The FICO® Platform Admin user can also see all of the current solutions. In the far-right column of each table row there is a pencil icon. Click it to access information about the solution, as well as the FICO® Platform Manager Logs generated during solution management operations.
© 2001-2025 Fair Isaac Corporation. All rights reserved. This documentation is the property of Fair Isaac Corporation (“FICO”). Receipt or possession of this documentation does not convey rights to disclose, reproduce, make derivative works, use, or allow others to use it except solely for internal evaluation purposes to determine whether to purchase a license to the software described in this documentation, or as otherwise set forth in a written software license agreement between you and FICO (or a FICO affiliate). Use of this documentation and the software described in it must conform strictly to the foregoing permitted uses, and no other use is permitted.