
Configuring Chart Axes
vdl-chart-axis element has several possible attributes:
These settings can be configured in the View designer and in the code editor.
View Designer Attributes pane
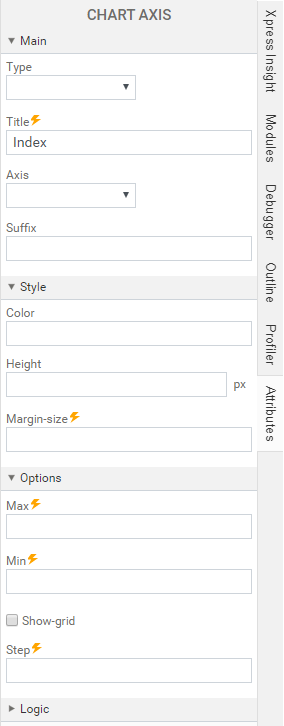
axisis a string value that can be set toxory.minis the minimum bound for the axis, that must be specified if you are using themaxattribute.maxis the maximum bound for the axis, that must be specified if you are using theminattribute.stepis the step increment for the axis.unitis the unit for the axis (code editor only).typeis a string that can be set tolinear,log,dateorcategory(default unless all series are of type scatter/line, when it defaults tolinear).titleis a string used as a title for an axis, which can be a dynamic expression.show-gridis a boolean, defaulting totrue, which controls whether a background grid is rendered. This can also be the result of a dynamic expression.
<vdl-chart>
<vdl-chart-axis axis="x" min="0" max="100" step="20" units="cm" type="category"></vdl-chart-axis>
<vdl-chart-axis axis="y" min="0" max="100" step="20" units="cm" type="category"></vdl-chart-axis>
</vdl-chart>
© 2001-2024 Fair Isaac Corporation. All rights reserved. This documentation is the property of Fair Isaac Corporation (“FICO”). Receipt or possession of this documentation does not convey rights to disclose, reproduce, make derivative works, use, or allow others to use it except solely for internal evaluation purposes to determine whether to purchase a license to the software described in this documentation, or as otherwise set forth in a written software license agreement between you and FICO (or a FICO affiliate). Use of this documentation and the software described in it must conform strictly to the foregoing permitted uses, and no other use is permitted.