
Charting with Multiple Scenarios
scenario attribute on a vdl-chart-series element.
Set its value to the index of the scenario you wish to use as the source of the data.
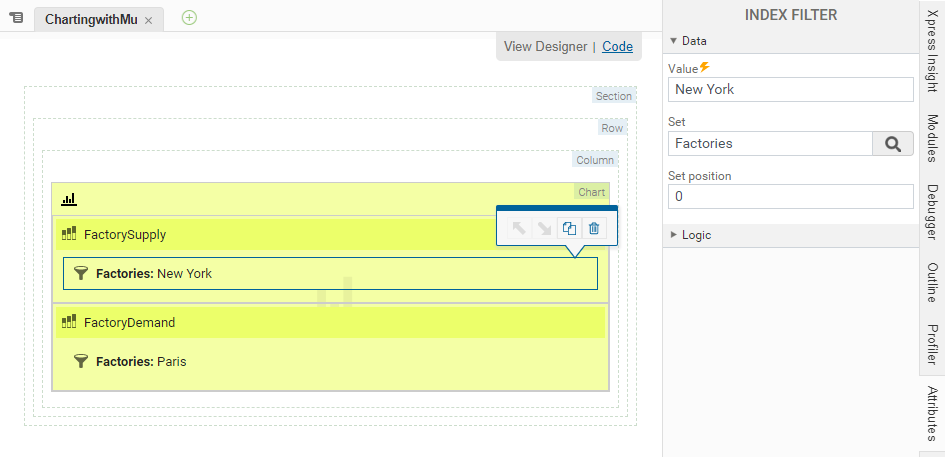
<vdl-chart>
    <vdl-chart-series type="bar" entity="FactorySupply" scenario="0">
        <vdl-index-filter set="Factories" value="New York"></vdl-index-filter>
    </vdl-chart-series>
    <vdl-chart-series type="bar" entity="FactoryDemand" scenario="1">
        <vdl-index-filter set="Factories" value="Paris"></vdl-index-filter>
    </vdl-chart-series>
</vdl-chart>
Pie charts are an exception to this principle, as multiple pie charts cannot be overlaid. In this case, you can draw multiple pie charts separately using the vdl-repeat attribute of vdl-chart, indexing through the scenarios as required.
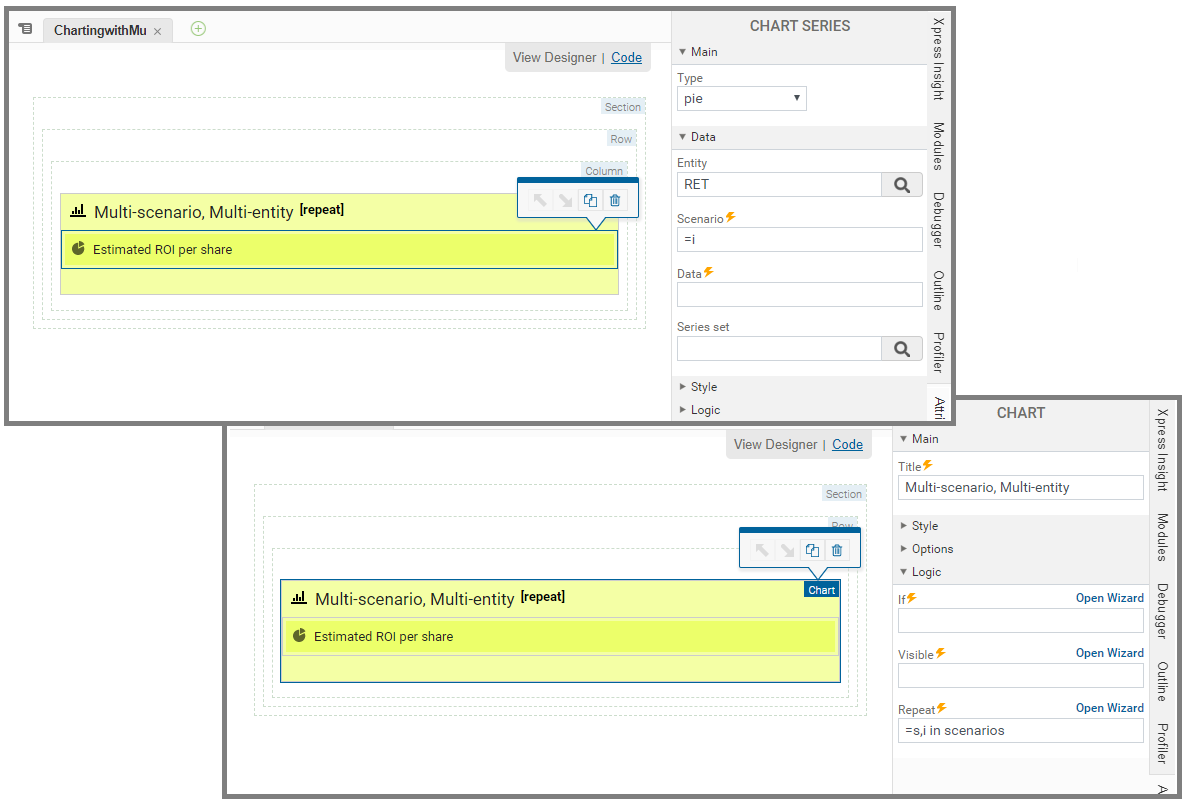
<vdl-chart vdl-repeat="=s,i in scenarios" title="Multi-scenario, Multi-entity">
<vdl-chart-series type="pie" scenario="=i" entity="RET"></vdl-chart-series>
</vdl-chart>
© 2001-2024 Fair Isaac Corporation. All rights reserved. This documentation is the property of Fair Isaac Corporation (“FICO”). Receipt or possession of this documentation does not convey rights to disclose, reproduce, make derivative works, use, or allow others to use it except solely for internal evaluation purposes to determine whether to purchase a license to the software described in this documentation, or as otherwise set forth in a written software license agreement between you and FICO (or a FICO affiliate). Use of this documentation and the software described in it must conform strictly to the foregoing permitted uses, and no other use is permitted.