
Decision Tree User Interface
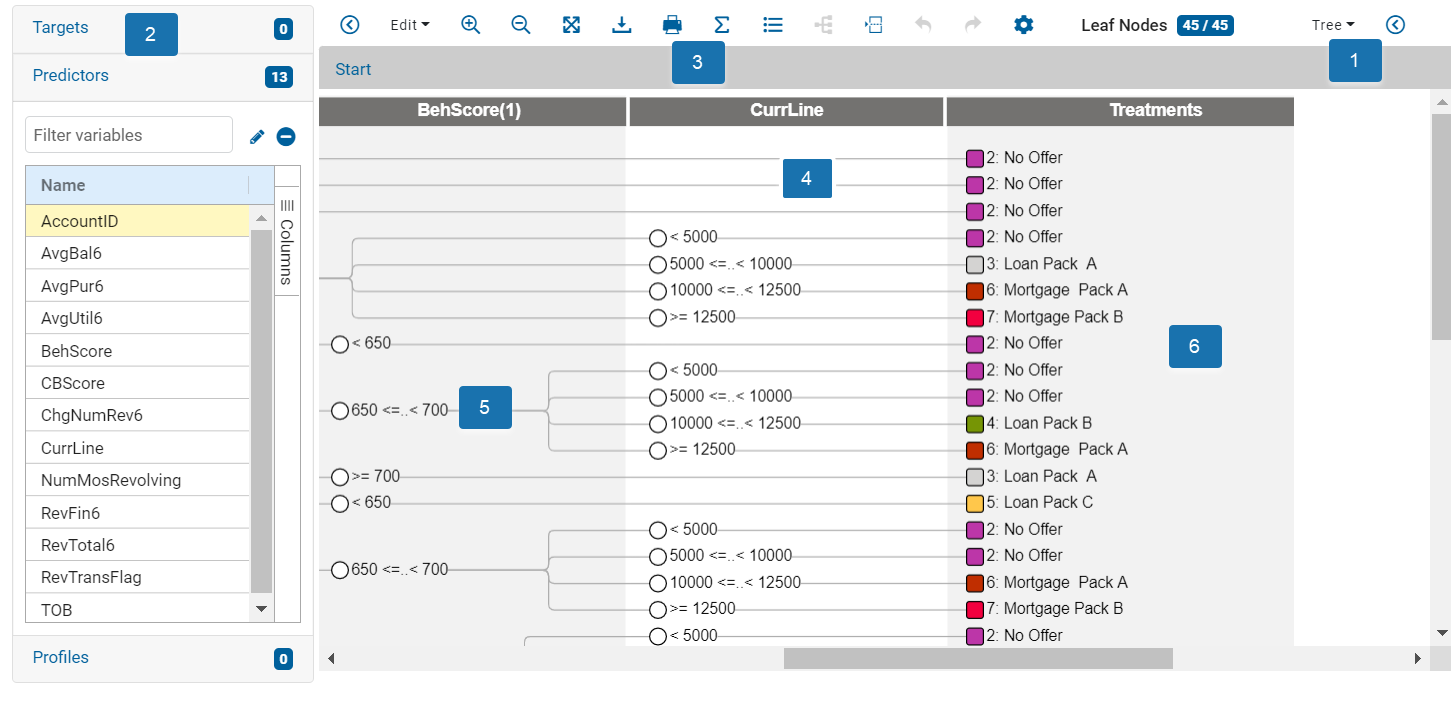
The decision tree user interface consists of three main areas:
- a panel on the left containing panes for adding and deleting variables used as predictors and profiles, as well as selecting target variables used for profiling
- a view sensitive toolbar at the top
- a canvas displaying the view
- Tree View for creating and editing the decision tree
- Profile View for profiling tree variables
- Leaf View for analyzing treatments using leaf node statistics
- Treatments Summary for viewing and analyzing a summary of treatments

|
Note: View preferences (such as the selected view and column configurations) are saved and maintained from one browser session to the next, as long as you are using the same browser.
|
In the Tree View, you can manually create or edit splits, and create and assign treatments.
With the menu on the left, you can:
- view and select Predictors as candidate split variables for the decision tree.
- view and select Target variables that will be available for profiling.
- view and add selected Profile variables for profiling the decision tree, to observe how input records are processed at each node — When you profile a decision tree, you choose one or more variables to follow through as the input data is processed.
Adding and Removing Target, Predictors, and Profile Variables
-
The Targets panel lists the target variable you selected when you created the decision tree, which becomes the primary target. Other targets that you add also appear in this panel.
- The Predictors panel lists the predictors you selected as candidate split variables for the decision tree. After computing a best split, the numeric predictors are sorted by their strongest predictive strength, measured by Gain.
- The Profiles panel lists the profile variables you selected for profiling in the decision tree. A notification badge count, on the right side of each panel column heading, indicates the number of targets, predictors, and profile variables, respectively.
Editing the Panel Target, Predictor, or Profile Variables
Selecting a predictor, profile, or target variable. The panels contain two tool buttons.
| Button | Description | ||
|---|---|---|---|
 |
Open the Configure targets, Choose predictors or Choose variables to profile dialog box | ||
 |
Remove an selected target, predictor, or profile variable from the panel.
|
Targets panel: Click the Targets heading to expand the panel.
Click the edit button to display the Configure targets dialog box, where you can add or remove one or more categorical variables (as designated in the Decision Impact Model> Data Roles view) to the decision tree. One of these can then be selected as the Target variable.
Targets that are not used in the decision tree can be removed from the panel. Shift-click or Command/Control-click to select multiple targets and then click the remove button. Removing a Target only removes it from the panel and does not remove it from the dataset.
Predictors panel: Click the Predictors heading to expand the panel. Click the edit button in the panel to display the Choose Predictors dialog box, where you can add or remove one or more candidate split variables for the decision tree. If predictors are not used in the decision tree, you can remove them from the panel. Shift-click or Command/Control-click to select multiple predictors and then click the remove button. Removing a predictor only removes it from the panel and does not remove it from the dataset.
Profiles panel: Click the Profiles heading to expand the panel. Click the edit button in the panel to display the Choose variables to profile dialog box, where you can add or remove one or more profile variables to view statistical information for each tree node. You can also remove one or more profile variables from the panel. Shift-click or Command/Control-click to select multiple profile variables and then click the remove button. Removing a profile variable only removes it from the panel and does not remove it from the dataset.
You can also search for predictors or profile variables listed in their respective panels.
|
|
Note: A
Y appears in the
Used column for all predictors that are levels in the decision tree. These levels can be empty or contain one or more decision nodes.
|
Navigating the Decision Tree User Interface
- Several treatments
- Four levels, including the start level
- Several splits
- A selected node
- View controls how your decision tree is displayed.
- TREE (default): Settings to help you refine your tree.
The TREE view contains a second options menu, available under the chevron icon.
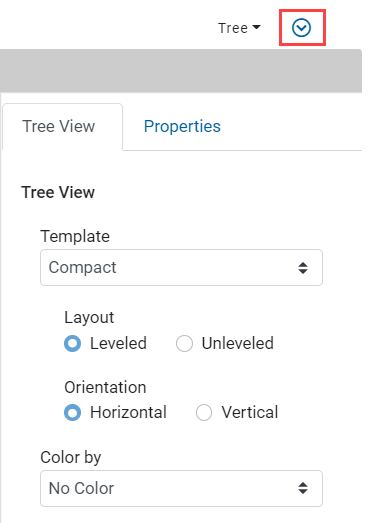 This menu contains the following settings:
- Template
- Compact—Displays node conditions and treatments without statistics (default view).
- Counts—Displays node conditions and treatments, as well as the total number of counts and percentage of the total. The Node Stats Options menu also enables the option to swap the displayed values between:
- weighted (W#T) or raw (#T) count values
- weighted (W%T) or raw (%T) percent values
- Layout
View the Decision Tree as either a Leveled or Unleveled tree.
View the Decision Tree in a Vertical (top down) or Horizontal (default) view using the Orientation option.
- Color By
- No Color (default)—Do not display a color.
- Treatments—Each node displays the weighted percentage of the total number of records assigned a treatment. The colors can be edited via the Assign Treatments dialogue, for more see Treatments and Decision Trees. The data in the decision tree must be counted to show this information.
You can view the distribution by color for each node in the COUNTS and COUNTS-LABEL views by selecting:
- Template
- PROFILE or LEAF—Profile your tree variables and analyze treatments using leaf node statistics.
Note: To use these views, you need to specify which of your tree variables are to be used as profiling variables. For more information on profile variables, see Choosing Profiling Statistics.
- TREATMENTS: Profile the treatments and provides aggregated count and weighted count per treatment.
- TREE (default): Settings to help you refine your tree.
-
The decision tree toolbar contains commands that let you edit, cut, copy, paste, or delete decision tree elements. Additionally, you can change the magnification of the decision tree by zooming in, out, or to fit the canvas.
EDIT displays the options to edit the tree. Possible actions are:- Trigger recount to update the statistics available for the various views.
- Compute best split (Available when Target variable is set) Automatically determine and include the best split for a node.
- Insert best split to compute and directly insert the best split.
- Insert best split - [selected predictor] to compute best split based on the selected predictor
- Compute percentile split to divide the data for a single numeric predictor node into the number of specified splits (available when there is no target variable.)
- Insert split to add a condition node with branches. A level is automatically created when you insert a split.
- Edit split to modify the conditions of the split.
- Insert level if you know the variables you want to use, in what order, and you want to capture this design before deciding the splits.
- Cut subtree to cut all nodes below the selected one.
- Copy subtree to copy all nodes below the selected one.
- Clear subtree to remove all nodes below the selected one
- Collapse subtree hides all nodes and edges below the selected node, and displays an arrow
 icon to indicate more information is available — Click the arrow to reveal the subtree.
 - Collapse entire tree hides all nodes and edges below the Start node, and displays an arrow icon to indicate more information is available — Click the arrow to reveal the subtree.
- Toolbar:

Zoom in 
Zoom out 
Zoom to fit 
Export the tree as FSML, FJDT, PMML, or SAS format file 
Print 
Recount 
Add, Delete and Modify Treatments 
Best Split Automatically determine and include the best split for a node, for more see Determining Best Split later in this topic.

Explore Recommended Splits (Available when Target variable is set) Suggest splitting values, for more see Determining Best Split later in this topic.

Undo (enabled when a change has been made) 
Redo (enabled when an undo has been performed) 
Settings - Level: Each vertical band in the tree, known as a level, corresponds to a variable marked as a Possible tree variable in the Data Roles > Configure Roles for Input Data pane (except the Start level and the Treatments level).
- Condition node: A conditional branching point in a decision tree. This node is displayed as a circle in Compact view or as a rectangle containing statistics in the Counts or Counts-label views.
- Treatments: The column furthest right in a decision tree displays the color-coded treatments applied to the end or leaf nodes.
© 2001-2024 Fair Isaac Corporation. All rights reserved. This documentation is the property of Fair Isaac Corporation (“FICO”). Receipt or possession of this documentation does not convey rights to disclose, reproduce, make derivative works, use, or allow others to use it except solely for internal evaluation purposes to determine whether to purchase a license to the software described in this documentation, or as otherwise set forth in a written software license agreement between you and FICO (or a FICO affiliate). Use of this documentation and the software described in it must conform strictly to the foregoing permitted uses, and no other use is permitted.