
Xpress-IVE Toolbars
Topics covered in this chapter:
- The Toolbars
- The Model Explorer Bar showing the entity tree
- The Project Explorer Bar
- Info Bar
- Tools Bar
- Run Bar
- The Output/Input tab of the Run Bar
- The Stats tab of the Run Bar
- The Matrix tab of the Run Bar
- The Objective tab of the Run Bar
- The MIP search tab of the Run Bar
- The BB tree tab of the Run Bar
- The User graph tab of the Run Bar
The Bars display rich information on the status of Xpress-IVE, the degree of success in compiling/running Mosel models, and results from runs. In addition, the Bars simplify user interaction with the application by placing most controls within easy reach. The Bars can be resized or repositioned—settings are always saved on exit.
The Toolbars
Navigation Toolbar

Execution Toolbar

- Show the 1. Name & Type wizard. (also present in Wizards menu)
- Show the 2. Parameters wizard. (also present in Wizards menu)
- Show the 3. Data Input wizard. (also present in Wizards menu)
- Show the 4. Variables wizard. (also present in Wizards menu)
- Show the 5. Objective wizard. (also present in Wizards menu)
- Show the 6. Constraints wizard. (also present in Wizards menu)
- Show the 7. Results & tuning wizard. (also present in Wizards menu)
- Show the 8. Text Output wizard. (also present in Wizards menu)
- Show the 9. Graphing wizard. (also present in Wizards menu)
- Show the 10. Programming wizard. (also present in Wizards menu)
- Show the 11. Debugging wizard. (also present in Wizards menu)
- Show the 12. Complete models wizard. (also present in Wizards menu)
Tools Toolbar

The Model Explorer Bar showing the entity tree
Can be shown/hidden by selecting Model Explorer Bar from the View menu or by clicking the ![]() icon on the Project pane.
icon on the Project pane.
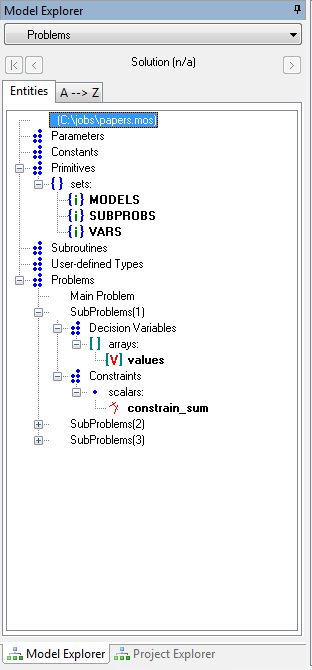
The Model Explorer Bar contains the entity tree, the A->Z entity list and the most recently accessed entities combo list:
 |
|
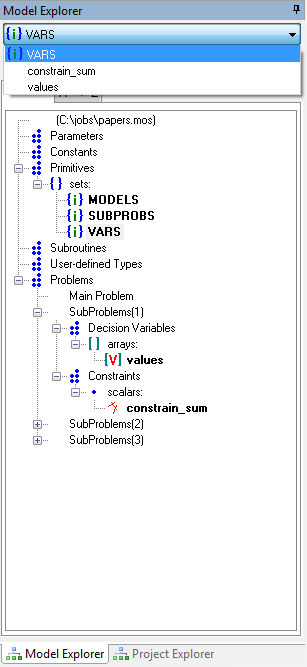 |
After the successful compilation of a Mosel model, the entity tree will be populated with identifiers from the model. After a successful execution of the model, the values of the identifiers appear in tooltips when the mouse is nearby. The complete values can be examined by double clicking on an identifier (which will open the View text dialog). If a model is being solved for multiple solutions, then the controls under recently-accessed entities list can be used to select a given solution (the best solution is chosen by default).
The identifiers are grouped in the following categories:
Parameters
Parameters can have the same type as Mosel primitives, but they are special entities as they can be used to pass information to a model without having to edit it.
Constants
Constants also have regular primitive types, but their values cannot change at runtime.
Primitives
These are primitive types (integer, real, boolean, string) either standalone or grouped into sets or arrays.
User types (defined within Mosel modules) will also appear here. Refer to the Mosel Native Interface documentation for details on how to define and use such external types.
Note that if user types do not support conversion to/from text, the values shown here will be meaningless.
Subroutines
A list of all the functions and procedures defined in the current model.
Problems
The main Mosel problem, and any other variables containing problem objects (which can be selected in model by use of the Mosel with statement). In the example images above, the model contains an variable called SubProblems, an array of 3 mpproblem objects.
Those entities which are displayed specific to a given problem are:
Decision variables
Representing the special mpvar Mosel type, decision variables are characterized by solution value and reduced cost after a successful optimization.
Linear constraints
Representing the special linctr Mosel type, linear constraints are characterized by activity value, slack and dual value after a successful optimization.
Note that decision variables and linear constraints will only display correct values if the optimization was successful and a solution was found.
The Project Explorer Bar
Can be shown/hidden by selecting Project Explorer Bar from the View menu or by clicking the ![]() icon on the Project pane. Creation, loading, and saving of Project files is handled by the Project menu.
icon on the Project pane. Creation, loading, and saving of Project files is handled by the Project menu.
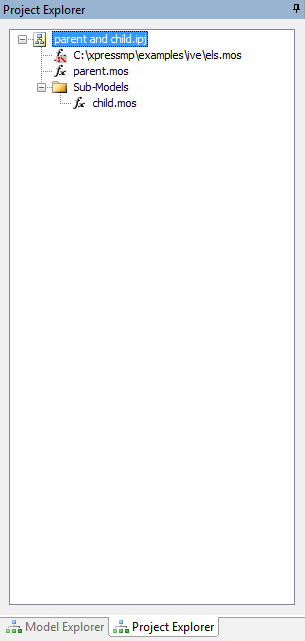
Projects in IVE are a collection of files (which can be any type, not just Mosel or XAD resource files), along with the options specified in the Run Options dialog. One can classify the files in a Project into a hierarchy of folders (not be confused with file system directories). Thus you might wish to arrange files in a Project according to purpose, for example:
- sub-models in one folder, and the main models that use them in another (or at the top level);
- a folder for each file type (as is the default behaviour for projects in Microsoft Visual Studio);
- folder layout to mirror the hierarchy of files on disk.
Files in a project will be stored as either absolute or relative paths. If a file in a project is in same directory as the project itself, or one of its subdirectories, its path will be stored relative to the project file's directory. A file from outside this directory hierarchy will be stored as an absolute path. In the example image above, the files parent.mos and child.mos are stored in the same directory as the project, whereas the file els.mos is in an unrelated directory and so is stored as an absolute path. Files with absolute paths have the ![]() stylised colon-backslash symbol overlaid on their icons in the project tree.
stylised colon-backslash symbol overlaid on their icons in the project tree.
Operations on Projects
There are a number of actions one can perform with a Project. Many of these are started by bringing up a context-menu, typically by right-clicking the mouse on an item in the project tree.
Pop-up menu for the Project
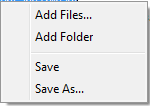
- Add Files...
- This brings up a file dialog box allowing the user to add files to the top level of the Project
- AddFolder
- This creates a new empty Folder (as a direct child of the Project), which can then be renamed and populated.
- Save
- Same as the Save action on the Project menu. (When you save a Project, all modified files within it are also saved).
- Save As...
- Same as the Save As action on the Project menu. (When you save a Project, all modified files within it are also saved).
Pop-up menu for files
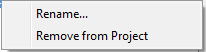
- Rename
- This makes the file name editable. See Editing file and folder names below. This can also be acheived by selecting the item in the Project tree and pressing F2.
- Remove from Project
- This removes the file from the project, but does not delete it from disk. This can also be acheived by selecting the item in the Project tree and pressing the Delete key.
Pop-up menu for folders
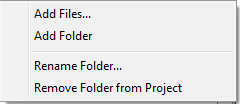
- Add Files...
- This brings up a file dialog box allowing the user to add files to this folder.
- AddFolder
- This creates a new empty folder (as a direct child of this folder), which can then be renamed and populated.
- Rename Folder
- This makes the folder name editable. See Editing file and folder names below. This can also be acheived by selecting the item in the Project tree and pressing F2.
- Remove Folder from Project
- This removes the folder (and any contents) from the project, but does not delete any files from disk. This can also be acheived by selecting the item in the Project tree and pressing the Delete key.
Drag-and-Drop within the Project tree
In order to rearrange the structure of the Project hierarchy, files and folders can be moved by Drag-and-Drop with the mouse. For instance, when a new folder has been created, other files or folders can be dragged into it.
Editing file and folder names
When a file or folder is made editable, a text box is brought up over its location with the current contents selected. Having adjusted the name, press the Enter key to confirm the change, or the Escape key to cancel. If you are renaming a file that is open in the IVE editor, the file will also be renamed in the editor. Note: you cannot use this method to move files to different directories, merely to rename files with a directory; this is why only the file name is editable, not the whole path.
Run options
When a Project is saved, the contents of the Run options dialog are saved with it. These options are then restored when the Project is reloaded. This facilitates keeping files together with their relevant settings.
The PROJECTDIR parameter
If a Project is laoded when a model is run, then a Mosel parameter named PROJECTDIR is set to the full path of directory in which the poject file is located. This value can be accessed in the usual way via a Mosel parameters...end-parameters block. This value can be seen in the Run options dialog. (If the users sets a Mosel parameter PROJECTDIR via the Run options dialog, this will override the Project-supplied version).
Info Bar
Can be shown/hidden by selecting Info Bar from the View menu or by clicking the icon on the Information pane.
The Info Bar consists of three views:
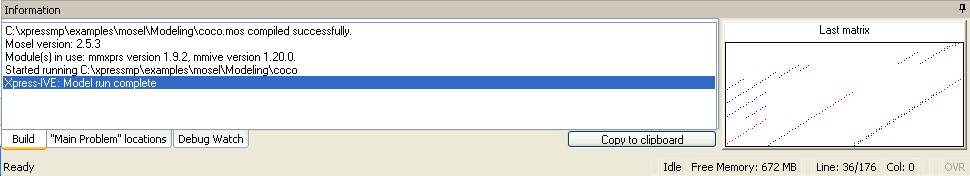
1. Build — Shows the status of the compilation of a Mosel model and reports errors if any. Click on an error to make the editor navigate to the offending line in the model. When running a model, some brief statistics and version information appear here. Press the button Copy to clipboard to copy the contents of the Build view to the Windows clipboard. Then paste into any text editor/email client.
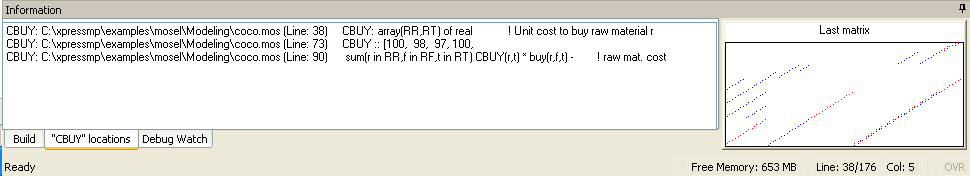
2. "..." locations — When an entity is clicked on in the entity tree, all the lines where the entity is present are added to this clickable list. Click on a line in the list to highlight it in the editor.
3. Debug watch — Editable list of identifiers whose value is shown.
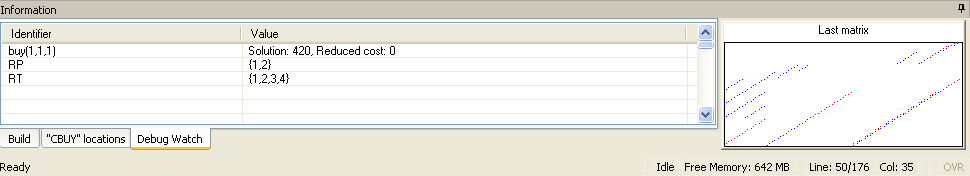
In addition, the Info Bar shows a sketch of the latest matrix loaded in the Optimizer. Note that the matrix may be "presolved".
Tools Bar
Can be shown/hidden by selecting Tools Bar from the View menu or by clicking the ![]() button on the Toolbar.
button on the Toolbar.

The Tools Bar is made up of five regions:
- On the left, a list of buttons corresponds to the files opened in the editor. Switch from one file to another simply by clicking the button having the chosen file name.
- The
 (Ctrl+Alt+Left) and
  (Ctrl+Alt+Right) buttons navigate through current and previous locations in the editor.
 - The
 (Ctrl+Alt+Up) and
  (Ctrl+Alt+Down) buttons find a previous or next line in the editor with the same indentation level as the current line.
 - The Find button (marked by binoculars) opens the search dialog.
- The search box can be typed in or pasted to from the clipboard. Press Enter to repeatedly search in the current file for occurrences of the word or expression in the search box.
- The small progress bar below the search box shows the position of the editing cursor in the current file.
- The context Help button – if pressed, it will attempt to find Help on the current word in the editor.
Run Bar
Can be shown/hidden by selecting Run Bar from the View menu or by clicking the ![]() icon on the Run pane.
icon on the Run pane.
The Run Bar groups together the following tabs/panes: Output/Input, Stats, Matrix, Solutions, Objective, MIP search, BB tree, User graph, CP stats, and CP search.
The Run Bar can be put into space-saving mode by enabling the Auto hide checkbox: when the mouse leaves the area of the Run Bar and enters the editor, the Run Bar will be hidden almost completely. When the mouse re-enters the Run Bar, it expands to its previous dimensions.
Below are snapshots of the different tabs/panes:
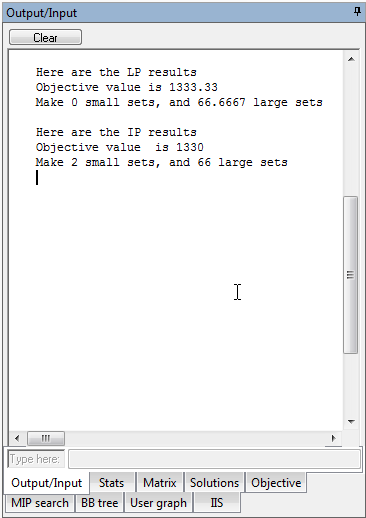
Output/Input
| Mosel output | Console-style user input: |
 |
 |
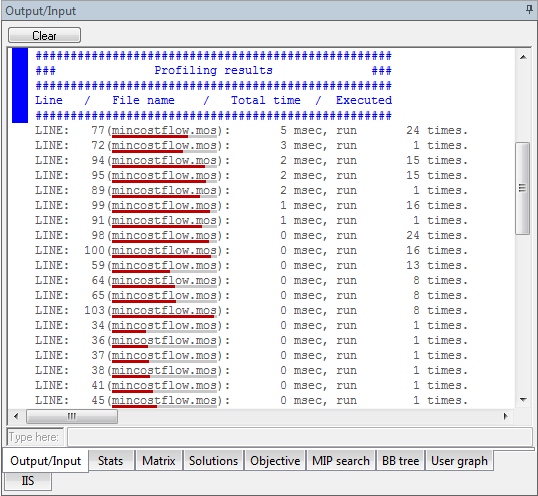
Profiler output:
Debugger output:
Optimizer output when a matrix file is run using the Optimizer Dialog:
Statistics
Optimizer status and statistics:
Matrix
A zoomable view of the matrix:

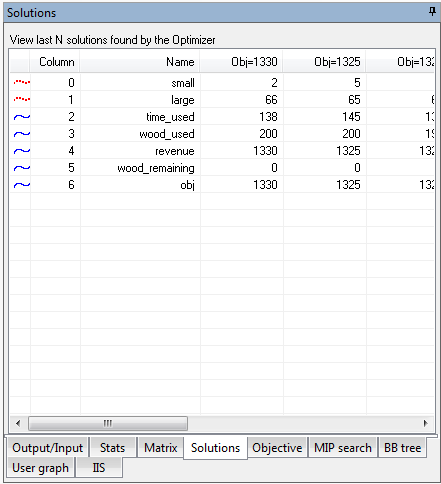
Solutions
The last N solutions found by the Optimizer:
Objective
Objective value progress during Simplex or Newton barrier:
MIP search
Progress of the global search for integer solutions:
BB tree
The evolution of the Branch and Bound MIP search:
User graph
Graph constructed by user during the Mosel run:
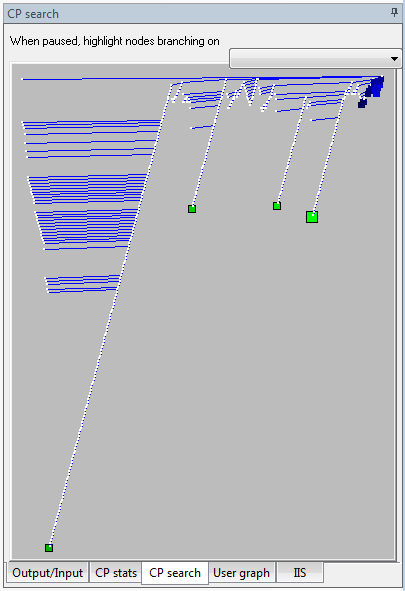
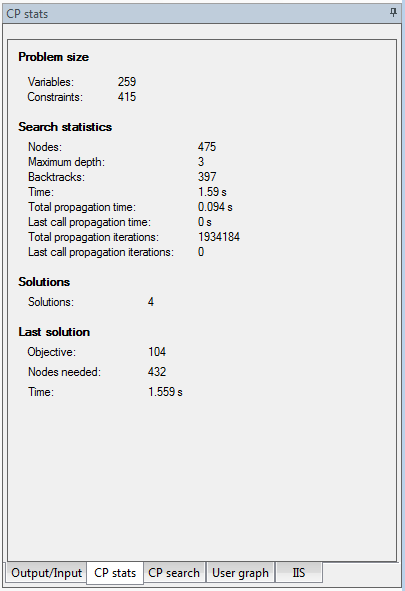
CP stats and CP search
Models using the Xpress-Kalis solver generate display in two additional tabs:
 |
 |
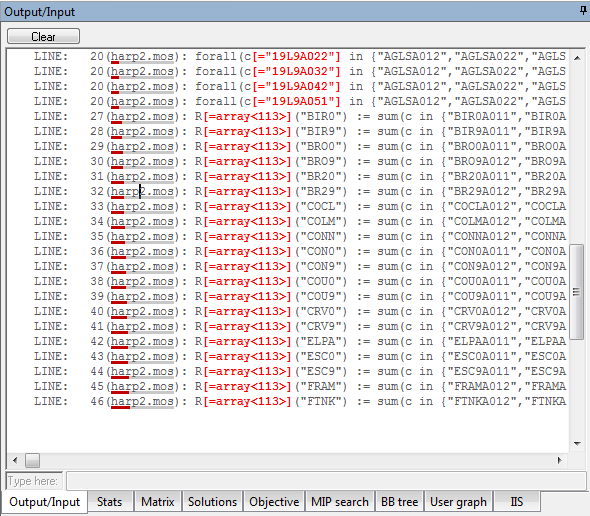
The Output/Input tab of the Run Bar
All write and writeln statements in Mosel produce character output that can be viewed in this window. Output from the Xpress Optimizer can also be shown by setting the boolean "mmxprs" parameter XPRS_VERBOSE.
Notes:
- To scroll the Output window using the keyboard, click once on the window to obtain the keyboard focus.
- Text can be selected and copied directly from the Output window.
- To clear the contents of the Output window, click on the Clear button.
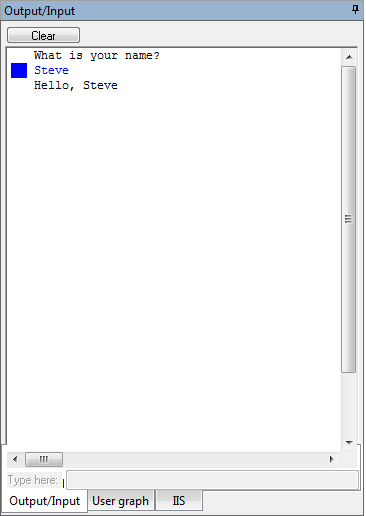
User input in the Output/Input tab of the Run Bar
When the user is required to input text during a Mosel run (when the read or readln statements are executed), the text can typed in the edit box marked Type here. (This edit box is disabled except when expecting user input).
Notes:
- To send the typed text to Mosel, press Enter.
- After text has been input, the left margin of the corresponding line from the Output window will be highlighted in blue.
- Call the Mosel procedure fflush to display all remaining text before asking for input.
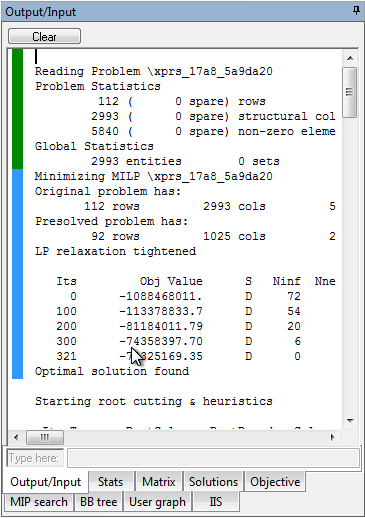
The Optimizer Output tab of the Run Bar
During a standalone Optimizer run (using the Optimizer dialog) or in the solving stage during a Mosel run (if the "mmxprs" parameter XPRS_VERBOSE was set to true), a textual Optimizer progress report will be produced in the Output window.
A typical output sequence from the Optimizer contains:
- A short version and copyright message from the Optimizer, marked with a blue margin (does not appear during a Mosel run).
- Information on any control parameter settings, written in magenta (does not appear during a Mosel run).
- The problem reading phase and statistics, marked with a dark green margin.
- The LP relaxation phase (Simplex or Barrier), marked with a light blue margin.
- The global search phase (if applicable), marked with an orange margin.
- The nonzero values in the solution vector, if a solution exists (does not appear during a Mosel run). These values are printed on alternating background colors to improve readability. There is no relationship between the background color and the value shown.
- To learn how to control the amount and frequency of textual output from the Optimizer, please refer to the Xpress-Optimizer reference manual or the 7. Results & tuning wizard.
Debugger output in the Output/Input tab of the Run Bar
While debugging Mosel code, the user has the option of printing the current executed line. The line can also be expanded to show current values of primitive identifiers (integers, strings, booleans, reals) and current sizes of arrays and sets (see the Debug Options dialog for more information).
Clicking on a line number will activate the corresponding line in the editor.
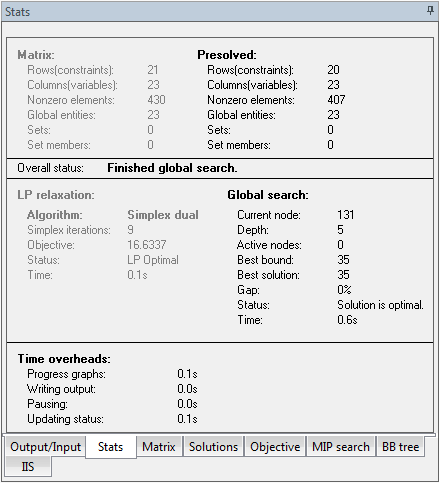
The Stats tab of the Run Bar
During the optimization (solving) stage of a Mosel run, or when optimizing a matrix file, this window pane displays the state of the Xpress Optimizer.
Text is highlighted (black) when the status or activity is current or currently taking place. Text is dimmed (gray) when the status information depicted is no longer current (e.g., when the optimizer is processing a presolved matrix, the before-presolve matrix is not currently relevant) or if the activity described is either finished and still relevant (the LP relaxation statistics are useful during the global search phase) or not started yet.
The Time overheads section shows the approximate time spent by Xpress-IVE on tasks other than optimization. Note that the time overhead created by other programs (processes) running on the same machine is not accounted for, even though they can slow down the optimization significantly.
The Matrix tab of the Run Bar
The Sketch View
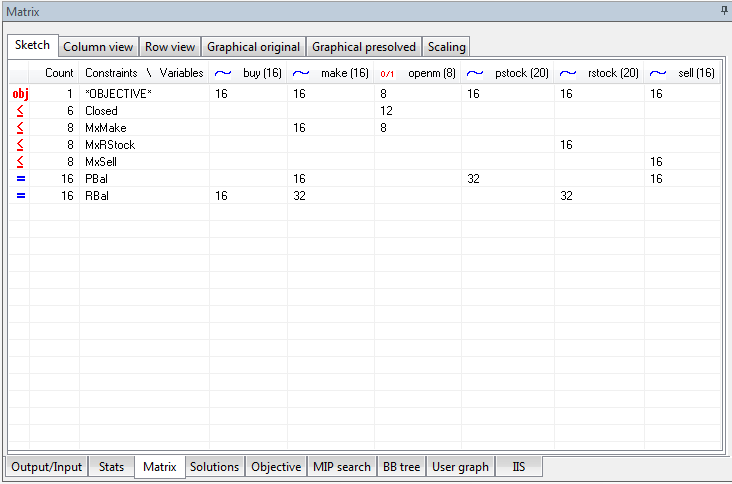
This view attempts to summarize arrays of constraints and arrays of variables into logical units to give a more concise representation of the matrix in the Optimizer.
In the example above, the following information can be gleaned about the matrix from the sketch view:
- There are 6 rows of type = which are named Closed.
- There are 8 rows of type = which are named MxMake.
- There are 8 rows of type = which are named MxRStock.
- There are 8 rows of type = which are named MxSell.
- There are 16 rows of type = which are named PBal.
- There are 16 rows of type = which are named RBal.
- In ALL the 6 = rows named Closed, variables named openm appear 12 times.
- In ALL the 8 = rows named MxMake, variables named make appear 16 times.
- In ALL the 8 = rows named MxMake, variables named openm appear 8 times.
- In ALL the 16 = rows named PBal, variables named make appear 16 times.
- In ALL the 16 = rows named PBal, variables named pstock appear 32 times.
- In ALL the 16 = rows named PBal, variables named sell appear 16 times.
- The objective function references variables named buy 16 times, variables named make 16 times, variables named openm 8 times, ...
- and so on...
Notes:
- Only constraints and variables sent to the Optimizer will be represented.
- In most cases, by examining the names of variables and constraints in the matrix, IVE can determine their 'roots' and implicitly the logical arrays they belong to. Sometimes, however, the intentions of the user may not be guessed correctly. Please keep in mind these actions performed by IVE on each variable and constraint name to determine its root:
- All blanks at the beginning of the name are removed.
- All blanks at the end of the name are removed.
- The name is then searched from left to right for any of these letters: "{[(0123456789". When any such letter is found, that letter and all subsequent letters are thrown away.
- If the previous three steps produce non-empty name, it is the designated as the root of the original name.
- If the previous three steps yield an empty name, start again with the original name and do the following:
- Remove all digits ("0123456789") from the name.
- The remaining letters in the name are designated as the root.
- Some examples:
The root of x[1,2] is x
The root of production_level("Detroit","April",5) is production_level
The Column View
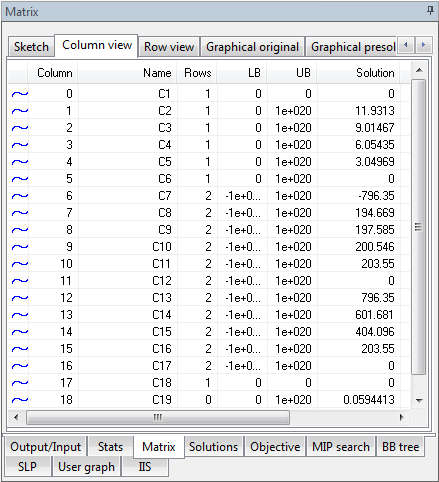
This view lists all variables (columns) in the matrix currently loaded in the Optimizer.
Note:
- Not all variables declared in the model may have been sent to the Optimizer!
- Values are updated as they become available (e.g., if a new integer solution was found, the values are immediately updated).
The headings are:
- An icon showing the type of the variable
- Column: The column number in the matrix for the current variable
- Name: The name of the variable, as understood by Mosel
- Rows: The number of rows(constraints) in which the variable participates
- LB: The lower bound for the variable
- UB: The upper bound for the variable
- Solution: The current solution value of the variable. Check problem status to see if solution is valid!
- Reduced cost: Current reduced cost. See above for validity.
- Type: Description of the type of the variable (continuous, binary, integer, semi-continuous, semi-continuous integer, partial integer)
The Row View
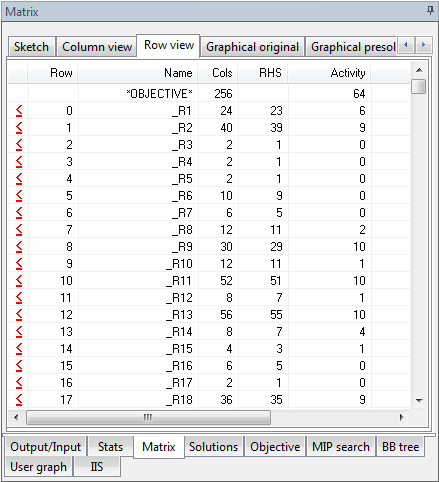
This view lists all constraints (rows) in the matrix currently loaded in the Optimizer.
Note:
- Not all constraints declared in the model may have been sent to the Optimizer: only constraints linked to the Objective function are sent to the Optimizer.
- Values are updated as they become available (e.g., activity values are updated when finding solutions).
The headings are:
- An icon showing the type of the constraint
- Row: The row number in the matrix for the current constraint
- Name: The name of the constraint, as understood by Mosel
- Cols: The number of variables(columns) with nonzero coefficients in this constraint(row)
- RHS: The right hand side of this constraint
- Activity: Its current activity value
- Slack: Its current slack value
- Dual: Its current dual value
- Type: Description of the type of the constraint (=, =,=, range, free)
The Graphical View
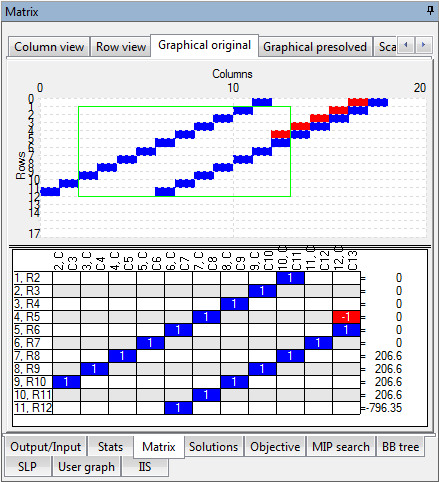
- Use the slider on the left to change the relative size of the two windows.
- If the matrix is small (less than a hundred rows and/or columns), each colored rectangle in the upper part of the window will represent one nonzero coefficient in the matrix.
- If the matrix is large or very large (above one thousand and up to hundreds of thousands of rows and/or columns), a colored rectangle will represent a region in the matrix, corresponding to a certain number of rows and columns. All the nonzero coefficients in the matrix (regardless of its size) are examined; only those regions that have at least one nonzero coefficient will be represented by a colored rectangle.
- The matrix can be zoomed into by clicking and holding the left mouse button and dragging right and down. After zooming, only the region marked by the zooming rectangle will be shown. The coefficients are recounted and the accuracy of the display will increase. After zooming deep in the matrix, a point can be reached where the colored rectangles represent actual coefficients in the matrix. When the current view is the result of a zoom one can move around the matrix by dragging with the right mouse button.
- To zoom out, double-click the left mouse button.
- The rectangle shown permanently next to the cursor acts as a magnifying glass. It marks a region consisting of 12 rows and 10 columns next to the cursor and brings that region into view in the lower part of the window. As the mouse cursor moves around in the matrix, the magnified region is constanly updated.
- The meaning of colors:
- Red — A negative coefficient or a region where all coefficients are negative.
- Blue — A positive coefficient or a region where all coefficients are positive.
- Purple — A region where some coefficients are positive and some coefficients are negative. The shade of purple indicates the predominance of either.
-
In the magnified 12×10 region, the names of the rows (constraints) and columns (variables) are shown (to enable the actual names used in the Mosel model, set the "mmxprs" boolean parameter XPRS_LOADNAMES to true).
At the top, following a comma after each column number is the type of variable:
C — indicates a continuous variable;
I — indicates an integer variables;
B — indicates a binary variable;
S — indicates a semi-continuous variable;
R — indicates a semi-continuous integer variable;
P — indicates a partial integer variable.On the right hand side, the type of constraint is shown. Note that < and > are used instead of the actual ≤ or ≥, to improve readability. In the case of a non-binding constraint, the character '*' is shown.
The Scaling View
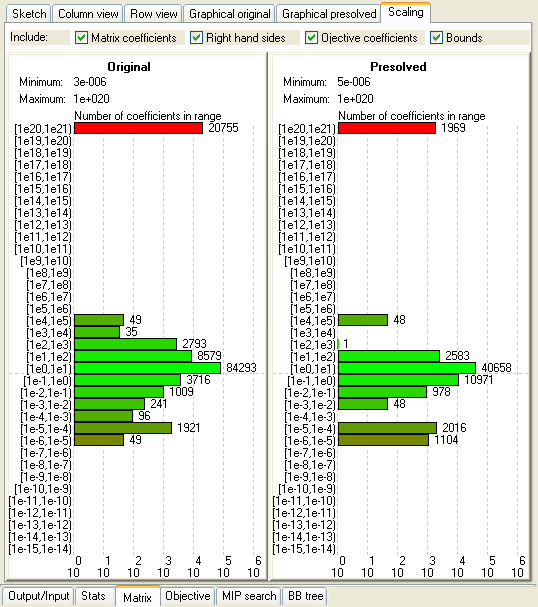
A histogram showing ranges for matrix coefficients, right hand sides, objective coefficients, and bounds.
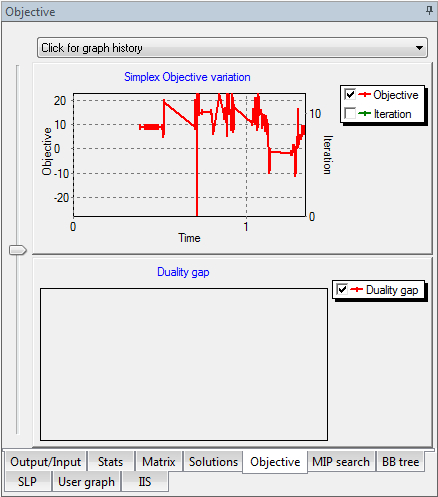
The Objective tab of the Run Bar
The graph on top shows the evolution in time of the objective value during the Simplex algorithm. The iteration is also plotted by time.
The graph at the bottom shows the evolution in time of the duality gap during the Newton barrier algorithm.
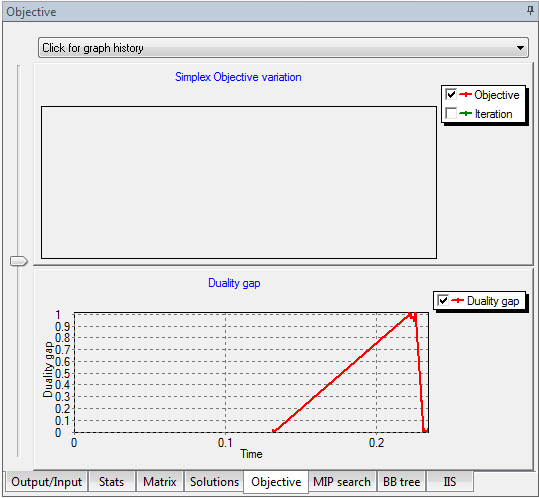
- At any time, only one of these progress graphs can be active (corresponding to the algorithm currently running).
- The graphs can be zoomed in and out and each curve can be shown or hidden using the checkboxes in the graph legend.
- Use the slider bar to change the vertical size of either graph.
- Xpress-IVE maintains a history of the last ten graphs produced. Select the desired graph from the list at the top. Note that the graph history cannot be accessed during an optimization.
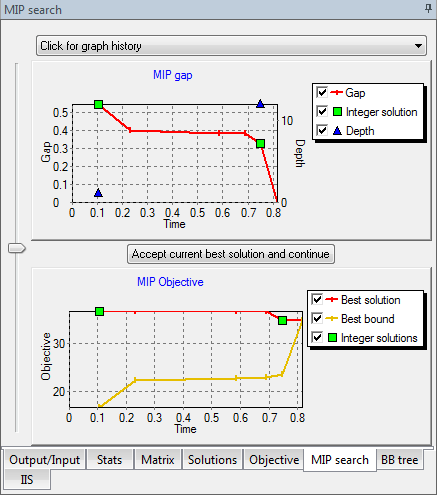
The MIP search tab of the Run Bar
The graph on top shows the evolution in time of the MIP gap during the global search. Also shown are the points where the integer solutions were found and the depth in the search tree at which each solution was found.
The graph below shows the progress of the current best integer solution objective relative to the best bound. Integer solutions are marked as well.
- The graphs can be zoomed in and out and each curve can be shown or hidden using the checkboxes in the graph legend.
- Use the slider bar to change the vertical size of either graph.
- Pressing the button "Accept current best solution and continue" will terminate the MIP search but the execution of the Mosel model will continue. This behavior is unlike that of the Stop button, which stops the entire model.
- Xpress-IVE maintains a history of the last ten graphs produced. Select the desired graph from the list at the top. Note that the graph history cannot be accessed during an optimization.
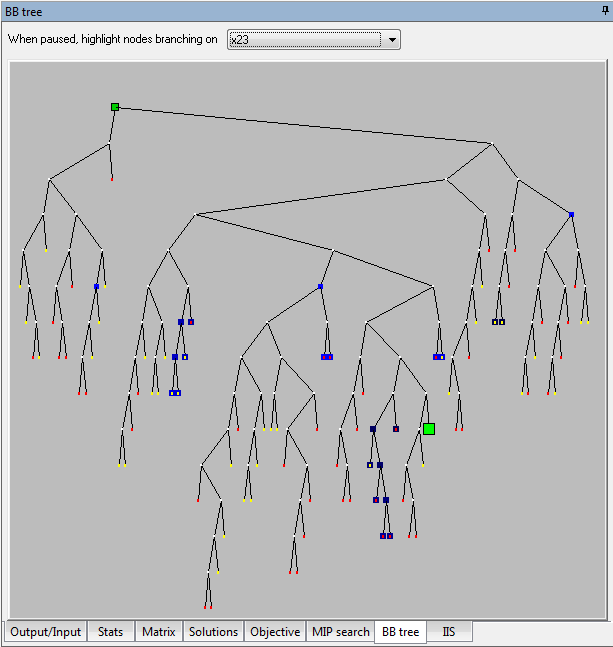
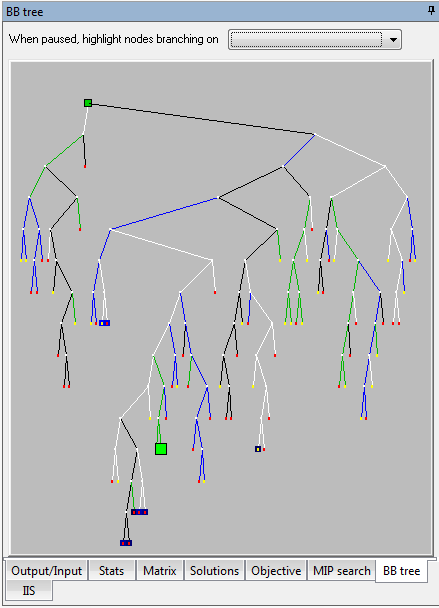
The BB tree tab of the Run Bar
The Branch and Bound tree is a representation of the search for an integer solution when optimizing MIP problems. To enable/disable drawing the BB tree use the Run Options dialog.
Notes:
- The tree is displayed for Mosel as well as Optimizer runs and it is updated continuously during the MIP search (to enable the names used in the Mosel model to appear in the tree, set the "mmxprs" boolean parameter XPRS_LOADNAMES to true).
- White nodes are either still active or in-tree.
- Red nodes are infeasible.
- Yellow nodes are cut off.
- The 20 most recent nodes are in decaying shades of blue, with bright blue being the most recent.
- The green nodes represent solutions. The best solution so far is green and large. The brighter the color, the more recent the solution.
- When hovering the mouse above a green solution node, a number will appear next to all solution nodes, indicating the order in which the solutions were found.
- If fewer than 5000 nodes have been visited so far, the entire tree will be drawn (see above).
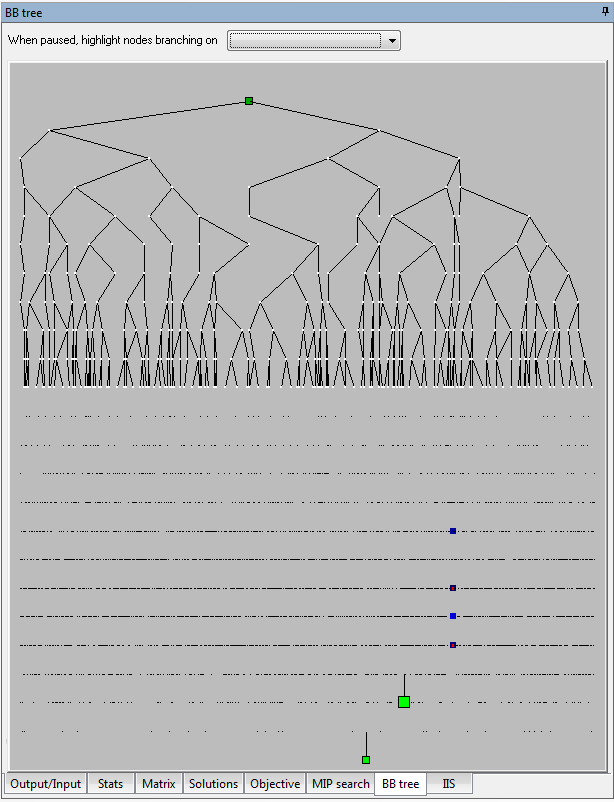
- If more than 5000 nodes have been visited, only nodes up to a depth of 10 will be drawn fully. The rest of the tree is summarized by scattered dots (which will turn into real nodes when zooming). Solutions and the 20 most recent nodes (in blue) are displayed regardless of their depth:
- Zoom in by holding the left mouse button down, dragging right and down and releasing it. A rectangle will indicate the area to be zoomed.
- Return to full tree view by clicking the left mouse button when zoomed.
- When zoomed, the lower left corner shows a scheme of the entire tree, while the "porthole" (representing the area seen in the main tree window) is highlighted:
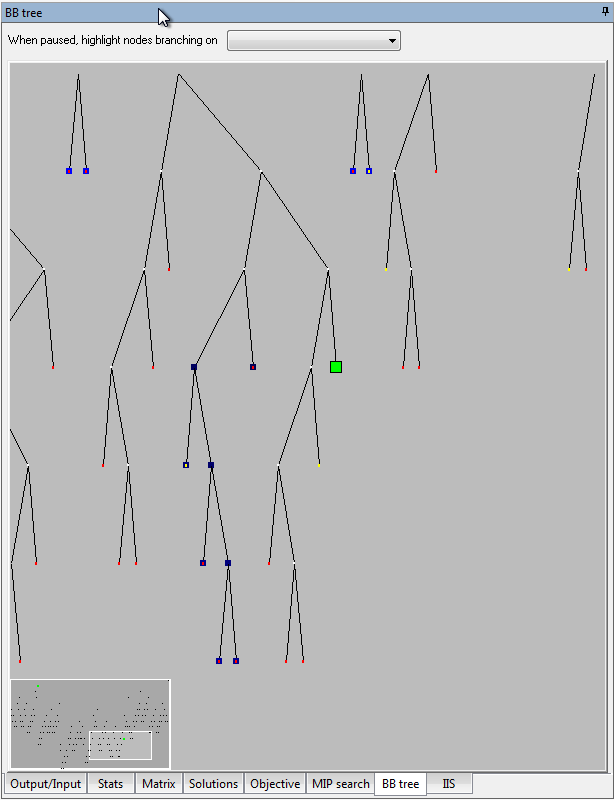
- To move around in the tree when zoomed, hold the right mouse button down and drag in any direction. The small preview window in the corner will continuously reflect the new position in the tree.
- The arrow keys will also move around in the tree (ensure the tree window has the focus by right-clicking in it - do not left click -- that will return to full tree view).
- If lost in the tree or if the image doesn't look correct, left click to return to full view.
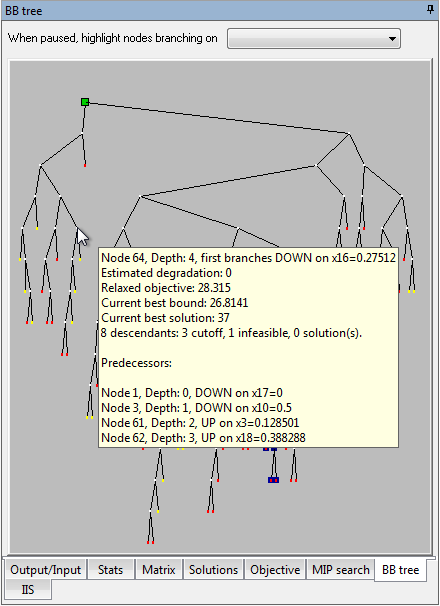
- Hovering the mouse above nodes will produce tooltips with information on the current node.
- The tooltips at each non-terminal node contain the following information:
– Node number
– Depth
– Initial branching direction
– The branching variable and its current relaxed solution value
– Relaxed objective
– Current best bound
– Current best solution
– Number of descendants
– How many descendants are cutoff, infeasible, solutions
– The ten most recent ancestors of the node, each with info on branching direction
- Double click on a node to obtain a listing of all of its ancestors (shown in the View text dialog).
- When the optimization is complete, paused or stopped, search for specific branching variables in the tree using the tree highlighter tool (can be enabled/disabled from the Run Options dialog): just select a variable name from the drop list and all visible nodes branching on that variable will begin to flash in alternating blue and yellow.
- To stop highlighting, select the first item in the highlighter tool droplist: the blank.
- While there is no limit on the size of the displayed tree, if the tree is very large (e.g. over 200,000 nodes on a PIII 800Mhz machine), it will react slowly to user actions.
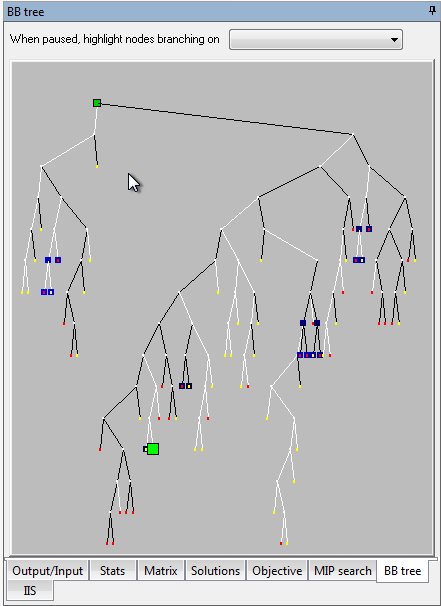
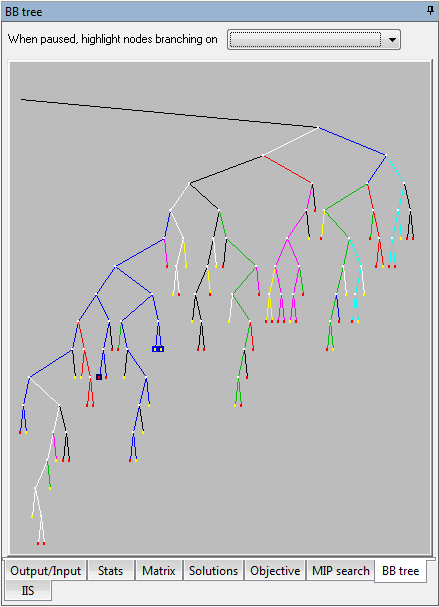
Parallel branch and bound trees
Note that each branch is colored according to the thread that processed the node. Shown below are trees obtained with 2, 4, and 8 threads.
| 2 threads | 4 threads |
 |
 |
| 8 threads |
 |
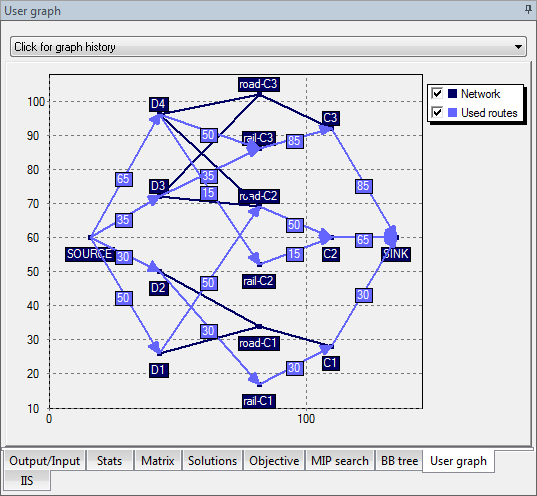
The User graph tab of the Run Bar
This window offers the opportunity to plot points on an unlimited two-dimensional grid when using the "mmive" Mosel library. The graph is automatically scaled to include all and only the plotted points. There is no limit on the number of items that can be plotted.
The "mmive" module in Mosel contains these functions and procedures:
- procedure IVEpause( message: string)
- Pauses the Mosel execution at the line where it was called. It also prints a message at the top of the Run Bar that may inform the user of the reason for pausing. While the execution is paused, model entities can be examined in the entity tree, or the user graph may be inspected in slow motion.
- function IVE_RGB( red: integer, green: integer, blue: integer): integer
- Compute a composite color by combining amounts of red, green and blue.
- function IVEaddplot(name:string, color:integer): integer
- Inserts a new plot on the user graph. A plot is indentified by its name and can be shown or hidden using its corresponding legend checkbox. The maximum number of distinct plots is currently limited to 20. However, each plot can contain an unlimited number of points, lines, arrows and labels. In the graph above, both "first fractal" and "second fractal" are plots. They can be shown/hidden using the checkboxes in the legend.
- procedure IVEdrawarrow(handle:integer, x1:real, y1:real, x2:real, y2:real)
- Add an arrow to an existing plot. The arrow connects the two points whose coordinates are given as parameters, pointing to the second one.
- procedure IVEdrawlabel(handle:integer, x:real, y:real, text:string)
- Add a text box to an existing plot. The box will be centered horizontally just above the point given.
- procedure IVEdrawline(handle:integer, x1:real, y1:real, x2:real, y2:real)
- Add a line to an existing plot. The line connects the two points whose coordinates are given as parameters.
- procedure IVEdrawpoint(handle:integer, x:real, y:real)
- Add a small square to mark a point at the given coordinates.
- procedure IVEerase
- Remove all plots and reset the user graph.
- procedure IVEzoom(x1:real, y1:real, x2:real, y2:real)
- Scales the user graph. The viewable area is determined by its lower left and upper right corners.
© 2001-2024 Fair Isaac Corporation. All rights reserved. This documentation is the property of Fair Isaac Corporation (“FICO”). Receipt or possession of this documentation does not convey rights to disclose, reproduce, make derivative works, use, or allow others to use it except solely for internal evaluation purposes to determine whether to purchase a license to the software described in this documentation, or as otherwise set forth in a written software license agreement between you and FICO (or a FICO affiliate). Use of this documentation and the software described in it must conform strictly to the foregoing permitted uses, and no other use is permitted.