Solving and viewing the solution
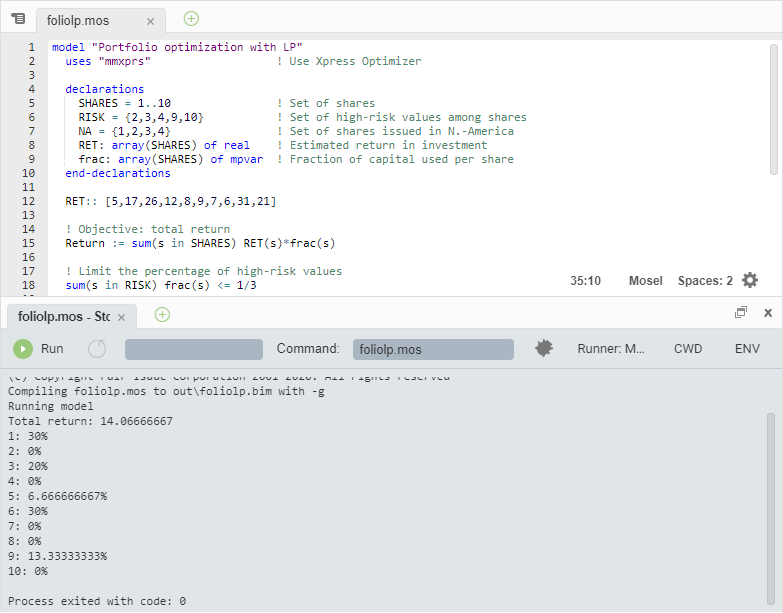
As mentioned in the previous section, to execute our model we have to select Run » Run foliolp.mos or alternatively, click on the run button: ![]() After the successful execution of our model the screen display changes to the following (Figure Display after model execution).
After the successful execution of our model the screen display changes to the following (Figure Display after model execution).

Figure 4.7: Display after model execution
The bottom window contains the log of the Mosel execution and if running in debug mode the left window displays all model entities. Choose the icon ![]() window to toggle full-screen display of the output printed by our program:
window to toggle full-screen display of the output printed by our program:
Total return: 14.0667
1: 30%
2: 0%
3: 20%
4: 0%
5: 6.66667%
6: 30%
7: 0%
8: 0%
9: 13.3333%
10: 0%
This means, that the maximum return of 14.0667 is obtained with a portfolio consisting of shares 1, 3, 5, 6, and 9. 30% of the total amount are spent in shares 1 and 6 each, 20% in 3, 13.3333% in 9 and 6.6667% in 5. It is easily verified that all constraints are indeed satisfied: we have 50% of North-American shares (1 and 3) and 33.33% of high-risk shares (3 and 9).
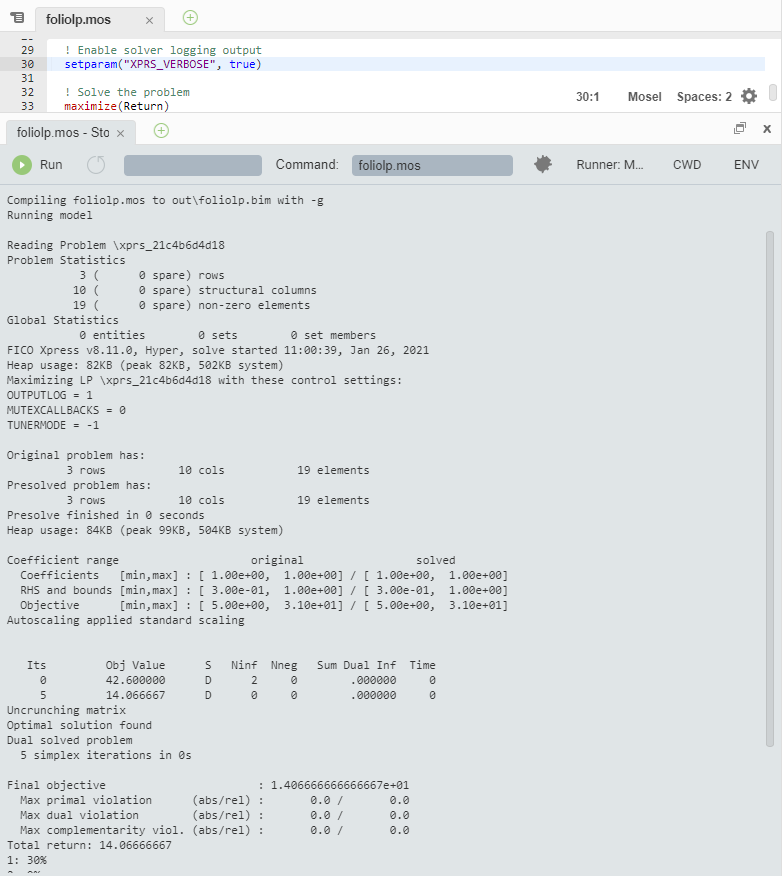
Now add the line
setparam("XPRS_VERBOSE", true)into your model before the call to maximize and re-run it. You will now see more detailed solution information than what is printed by our model (Figure Solver log display). The upper part of the log contains some statistics about the matrix, in its original and in presolved form (presolving a problem means applying some numerical methods to simplify or transform it). The center part tells us which LP algorithm has been used (Simplex), and the number of iterations and total time needed by the algorithm. Since this problem is very small, it is solved almost instantaneously. After the solver log you see as before the output produced by your model.

Figure 4.8: Solver log display
String indices
To make the output of the model more easily understandable, it may be a good idea to replace the numerical indices by string indices.
In our model, we replace the three declaration lines
  SHARES = 1..10
  RISK = {2,3,4,9,10}
  NA = {1,2,3,4}
with the following lines:
  SHARES = {"treasury", "hardware", "theater", "telecom", "brewery",
            "highways", "cars", "bank", "software", "electronics"}
  RISK = {"hardware", "theater", "telecom", "software", "electronics"}
  NA = {"treasury", "hardware", "theater", "telecom"}
And in the initialization of the array RET we now need to use the indices:
 RET::(["treasury", "hardware", "theater", "telecom", "brewery",
        "highways", "cars", "bank", "software", "electronics"])[
	5,17,26,12,8,9,7,6,31,21]
No other changes in the model are required. We save the modified model as foliolps.mos.
The solution output then prints as follows which certainly makes the interpretation of the result easier and more immediate:
Total return: 14.0667
treasury: 30%
hardware: 0%
theater: 20%
telecom: 0%
brewery: 6.66667%
highways: 30%
cars: 0%
bank: 0%
software: 13.3333%
electronics: 0%
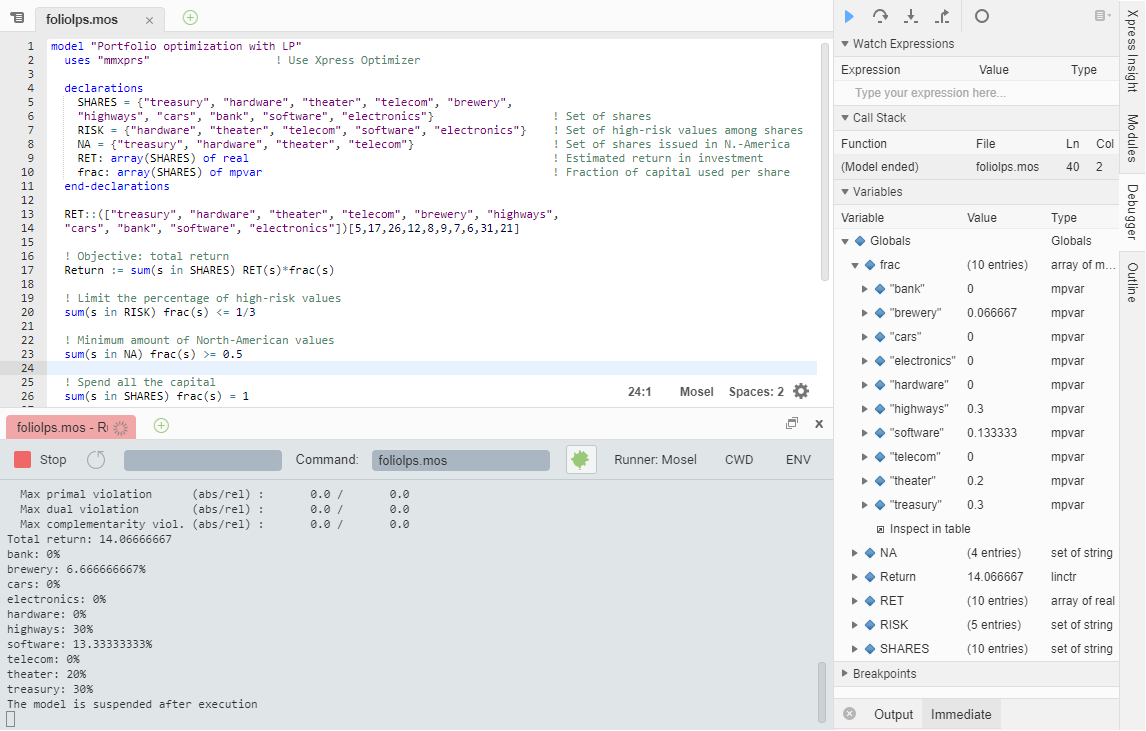
Of course, the entity display also works with these string names:

Figure 4.9: Entity display
© 2001-2025 Fair Isaac Corporation. All rights reserved. This documentation is the property of Fair Isaac Corporation (“FICO”). Receipt or possession of this documentation does not convey rights to disclose, reproduce, make derivative works, use, or allow others to use it except solely for internal evaluation purposes to determine whether to purchase a license to the software described in this documentation, or as otherwise set forth in a written software license agreement between you and FICO (or a FICO affiliate). Use of this documentation and the software described in it must conform strictly to the foregoing permitted uses, and no other use is permitted.

