

Optimization Workflows
Topics covered in this chapter:
Running optimization models
We demonstrate with a multi-period production planning problem: a factory produces multiple products over several months, and we want to maximize profit while respecting monthly capacity. This example also shows how Pandas DataFrames and Series are passed as input and how multiple output arrays are returned.
Mosel model
Create production.mos. The model receives sets, Series, and a DataFrame from Python through initializations from "moselpy:", and returns four output arrays plus the total profit. Note how Mosel's syntax closely resembles mathematical notation:
model "multiperiod_production"
  uses "mmxprs"

  parameters
    DATASOURCE = "production.dat"
  end-parameters

  public declarations
    PRODUCTS: set of string
    MONTHS: set of string

    Profit: array(PRODUCTS) of real
    Demand: array(PRODUCTS, MONTHS) of real
    Capacity: array(MONTHS) of real
    Duration: array(PRODUCTS) of real

    produce: array(PRODUCTS, MONTHS) of mpvar
    CapLimit: array(MONTHS) of linctr

    ! Output arrays
    Production: array(PRODUCTS, MONTHS) of real
    MonthlyRevenue: array(MONTHS) of real
    ProductRevenue: array(PRODUCTS) of real
    CapacityUsed: array(MONTHS) of real
    TotalProfit: real
  end-declarations

  initializations from DATASOURCE
    Profit Demand Capacity Duration
  end-initializations

  ! Upper bound: production cannot exceed demand (lower bound defaults to 0)
  forall(p in PRODUCTS, m in MONTHS) produce(p, m) <= Demand(p, m)

  ! Capacity constraint per month (naming enables getact after solve)
  forall(m in MONTHS)
    CapLimit(m) := sum(p in PRODUCTS) Duration(p) * produce(p, m) <= Capacity(m)

  ! Maximize profit
  maximize(sum(p in PRODUCTS, m in MONTHS) Profit(p) * produce(p, m))

  ! Store results
  TotalProfit := getobjval
  forall(p in PRODUCTS, m in MONTHS) Production(p, m) := getsol(produce(p, m))
  forall(m in MONTHS) do
    MonthlyRevenue(m) := sum(p in PRODUCTS) Profit(p) * getsol(produce(p, m))
    CapacityUsed(m) := getact(CapLimit(m))
  end-do
  forall(p in PRODUCTS) ProductRevenue(p) := sum(m in MONTHS) Profit(p) * getsol(produce(p, m))

  initializations to DATASOURCE
    TotalProfit Production MonthlyRevenue ProductRevenue CapacityUsed
  end-initializations
end-model
Python code
Build input data using Pandas. A DataFrame encodes demand by product and month; Series encode per-product and per-month scalar data. Pass them directly to run(). MoselPy converts them automatically, using the index as the set dimension:
import pandas as pd
import moselpy as mp

products = ["Widgets", "Gadgets", "Gizmos"]
months = ["Jan", "Feb", "Mar", "Apr", "May", "Jun"]

# Demand varies by product and month (2D -> Mosel array(PRODUCTS, MONTHS))
demand_df = pd.DataFrame({
    "Jan": [100, 80, 60], "Feb": [120, 90, 70], "Mar": [140, 100, 80],
    "Apr": [130, 95, 75], "May": [110, 85, 65], "Jun": [90, 70, 55],
}, index=products)

profit_series   = pd.Series({"Widgets": 25, "Gadgets": 40, "Gizmos": 55})
duration_series = pd.Series({"Widgets": 1.0, "Gadgets": 1.5, "Gizmos": 2.0})
capacity_series = pd.Series({
    "Jan": 200, "Feb": 220, "Mar": 240, "Apr": 230, "May": 210, "Jun": 180
})

mp.compile_model("production.mos", "production.bim")
model = mp.load_model("production.bim")
model.set_default_stream(mp.StreamType.OUTPUT, "null:")

output = model.run(
    exec_params={"DATASOURCE": "moselpy:"},
    input_data={
        "Profit": profit_series,
        "Demand": demand_df,
        "Capacity": capacity_series,
        "Duration": duration_series,
    })

print(f"Total Profit: ${output['TotalProfit']:,.2f}")
Output: Total Profit: $34,808.33
The full output arrays (Production, MonthlyRevenue, ProductRevenue, CapacityUsed) are also available in output. See Section Accessing results for how to retrieve and display them.
Problem status
After running an optimization model, check the execution status using the exec_status attribute and the optimization status using the prob_status object before trying to access any solution information. The exec_status indicates whether the model executed without errors, while prob_status indicates whether a solution is available:
import moselpy as mp

model = mp.load_model("model.bim")
output = model.run(input_data=data)

# Check execution status
if model.exec_status == mp.ExecStatus.OK:
    print("Model executed successfully")

    # Check optimization status
    if model.prob_status.is_solution_optimal:
        print("Optimal solution found")
    elif model.prob_status.is_problem_infeasible:
        print("Problem is infeasible")
    elif model.prob_status.is_problem_unbounded:
        print("Problem is unbounded")
    else:
        print("No optimal solution found")
else:
    print(f"Execution error: {model.exec_status}")
Output:
Model executed successfully
Optimal solution found
The prob_status object provides boolean properties:
- is_solution_optimal
- is_solution_available
- is_problem_infeasible
- is_problem_unbounded
- is_optimization_finished
- is_optimization_failed
- is_problem_valid
If the model does not call maximize or minimize, prob_status.status_code returns -1 and all is_* properties are set to False. For the full list of status codes, see the Xpress Optimizer Reference Manual.
The objective function value is available directly via model.objective_value. The exit code from the Mosel model (set via exit statement, defaults to 0 indicating successful execution) is available as model.exit_code. See Chapter Model Class for the full reference.
Accessing results
There are two methods to retrieve results after running a model. Always check the prob_status object before trying to access any solution information. For converting results to Pandas Series and DataFrames, see Section Pandas integration.
Method 1: run() return value
The run() method returns a dictionary containing all variables explicitly output by the Mosel model via initializations to "moselpy:". Scalars are returned as Python scalars; arrays are returned as dicts.
output = model.run(input_data=data)

# Scalar
profit = output['TotalProfit']
print(f"Total Profit: ${profit:,.2f}")

# 1D array -> dict
product_revenue = output['ProductRevenue']  # {'Gadgets': ..., 'Gizmos': ..., 'Widgets': ...}

# 2D array -> dict with tuple keys
production = output['Production']  # {('Gadgets','Jan'): ..., ('Gizmos','Jan'): ..., ...}
Output:
Total Profit: $34,808.33
Only variables listed in the Mosel initializations to "moselpy:" block are included in the output dict. Use Method 2 to access any other model entity after the solve.
Method 2: find_identifier()
find_identifier() retrieves the value of any public model entity by name after a solve, including variables not in the output block. It can return raw Python values or Pandas objects. Entities must be declared with the explicit public keyword in the Mosel source. When the model is compiled with the g or G flag, all global symbols become visible:
model.run(input_data=data)

# Scalar
profit = model.find_identifier("TotalProfit")
print(f"TotalProfit: {profit:.2f}")

# 1D array as dict (default)
product_revenue = model.find_identifier("ProductRevenue")
print(product_revenue)

# 1D array as Pandas Series
product_revenue_series = model.find_identifier("ProductRevenue", use_pandas=True)
print(product_revenue_series)
Output:
TotalProfit: 34808.33
{'Gadgets': 12533.33, 'Gizmos': 22275.0, 'Widgets': 0.0}
Gadgets    12533.33
Gizmos     22275.00
Widgets        0.00
dtype: float64
Use find_identifier() when you need to inspect intermediate variables or parameters that are not part of the model output, for example for debugging or post-solve analysis.
Visualizing results
Optimization results from MoselPy integrate naturally with matplotlib, enabling production dashboards and analysis charts. This section continues the multi-period production example from the previous section.
Retrieving results as Pandas objects
Use find_identifier() with the use_pandas=True flag to retrieve output arrays as Pandas objects. For 1D arrays it returns a Series; for 2D arrays it returns a Series with a MultiIndex, which can be unstacked into a DataFrame:
# 1D arrays -> Series
monthly_revenue = model.find_identifier("MonthlyRevenue", use_pandas=True)
product_revenue = model.find_identifier("ProductRevenue", use_pandas=True)
capacity_used   = model.find_identifier("CapacityUsed", use_pandas=True)

# 2D array -> MultiIndex Series, unstack to DataFrame
production_df = model.find_identifier("Production", use_pandas=True).unstack(level=1)
print(production_df)
Output:
           Jan    Feb    Mar    Apr    May    Jun
Widgets   0.00   0.00   0.00   0.00   0.00   0.00
Gadgets  53.33  53.33  53.33  53.33  53.33  46.67
Gizmos   60.00  70.00  80.00  75.00  65.00  55.00
Production dashboard
Plot a four-panel chart: monthly production by product (stacked bars), revenue share by product (pie), capacity utilization over time (fill chart), and monthly revenue trend (bar chart):
import matplotlib.pyplot as plt

fig, axes = plt.subplots(2, 2, figsize=(12, 10))

# 1. Production by product (stacked bar)
production_df.T.plot(kind="bar", stacked=True, ax=axes[0, 0], colormap="viridis")
axes[0, 0].set_title("Monthly Production by Product")
axes[0, 0].set_xlabel("Month")
axes[0, 0].set_ylabel("Units")
axes[0, 0].tick_params(axis='x', rotation=45)

# 2. Revenue by product (pie)
product_revenue_ordered = product_revenue.reindex(products)
axes[0, 1].pie(product_revenue_ordered, labels=products,
               autopct='%1.1f%%', startangle=90)
axes[0, 1].set_title("Revenue Share by Product")

# 3. Capacity utilization (fill + line)
capacity_ordered = capacity_series.reindex(months)
used_ordered = capacity_used.reindex(months)
x = range(len(months))
axes[1, 0].fill_between(x, capacity_ordered, alpha=0.3, label="Available")
axes[1, 0].plot(x, used_ordered, 'o-', linewidth=2, markersize=8, label="Used")
axes[1, 0].set_xticks(x)
axes[1, 0].set_xticklabels(months)
axes[1, 0].set_title("Capacity Utilization")
axes[1, 0].legend()

# 4. Monthly revenue (bar)
monthly_ordered = monthly_revenue.reindex(months)
axes[1, 1].bar(months, monthly_ordered, color="steelblue")
axes[1, 1].set_title("Monthly Revenue")
axes[1, 1].set_ylabel("Revenue ($)")

plt.tight_layout()
plt.show()
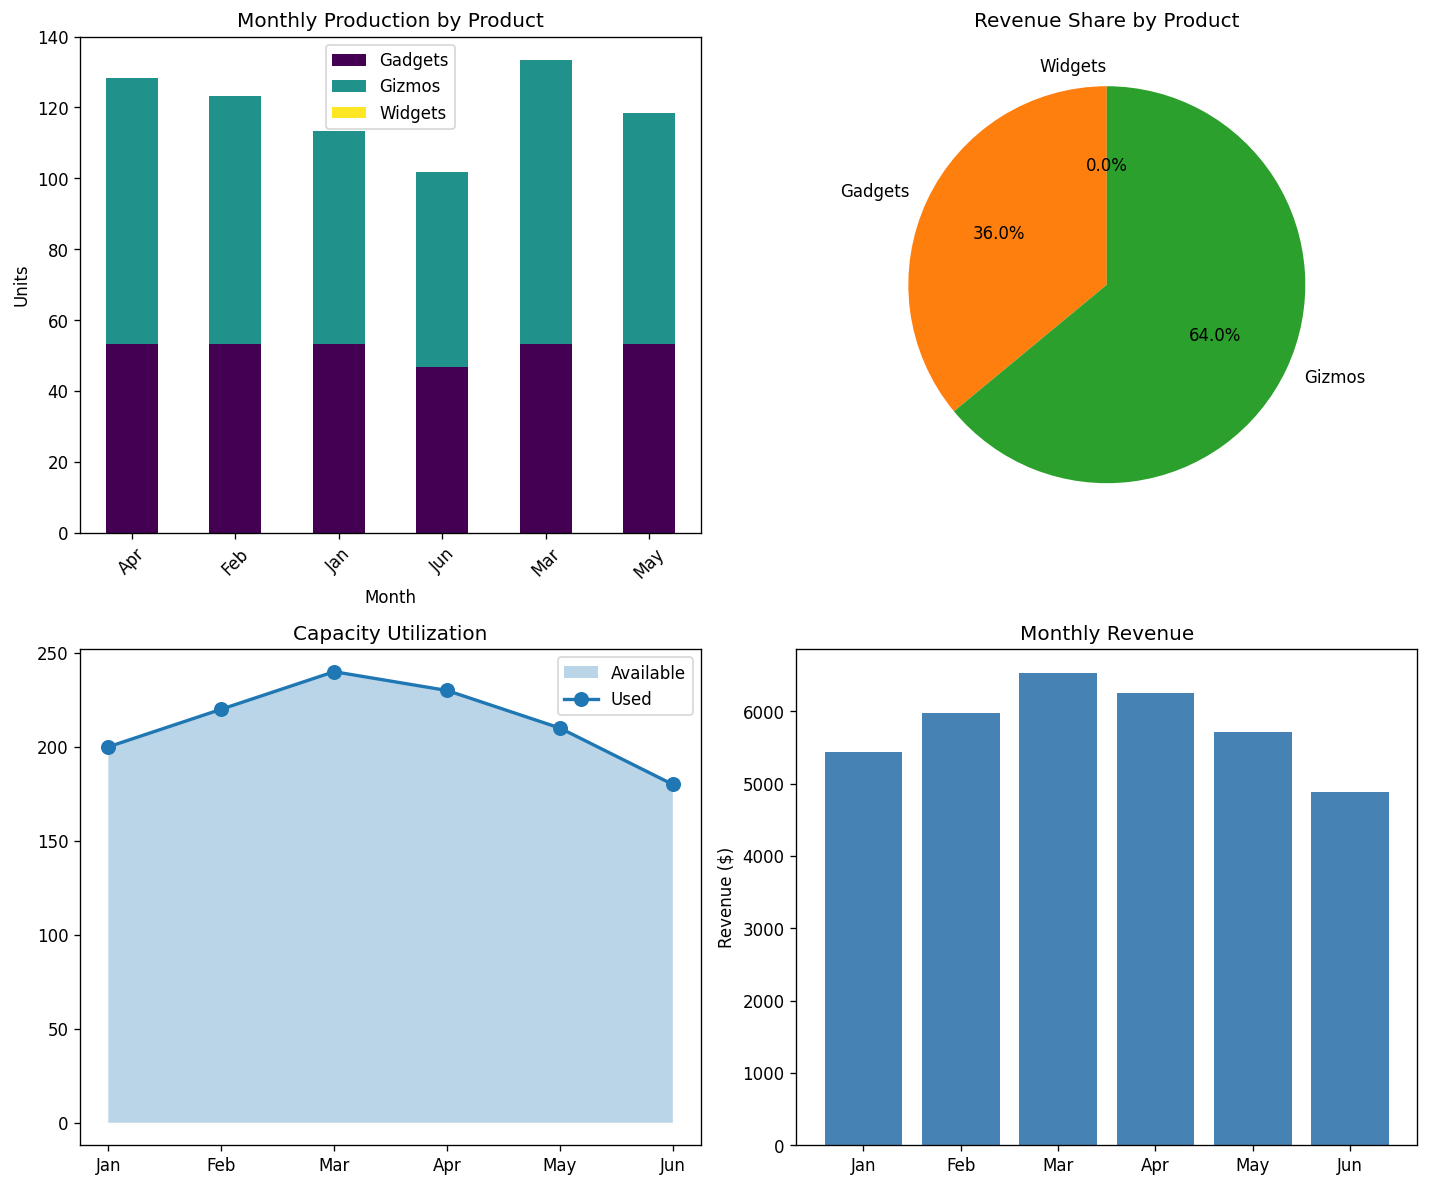
Figure 4.1: Production dashboard: monthly production by product, revenue share, capacity utilization, and monthly revenue
© 2001-2026 Fair Isaac Corporation. All rights reserved. This documentation is the property of Fair Isaac Corporation (“FICO”). Receipt or possession of this documentation does not convey rights to disclose, reproduce, make derivative works, use, or allow others to use it except solely for internal evaluation purposes to determine whether to purchase a license to the software described in this documentation, or as otherwise set forth in a written software license agreement between you and FICO (or a FICO affiliate). Use of this documentation and the software described in it must conform strictly to the foregoing permitted uses, and no other use is permitted.