US Bankcard Industry Benchmarking Trends: Q1 2026
Delinquency rates are beginning to stabilize, but millions of American consumers are still running out of financial runway

While headline delinquency metrics in the U.S. bankcard market are showing the first signs of stabilization in Q1 2026, a plateau isn’t a recovery. Beneath the surface, many American consumers are quietly but persistently running out of financial runway. Payment rates are at multi-year lows, credit limits are contracting, and the share of Americans making only the minimum payment on their credit cards has nearly doubled since 2022.
Key Takeaways
Financial Stabilization Isn’t Recovery. Q1 2026 shows the first signs of delinquency plateauing, but this should not be mistaken for a genuine recovery. The underlying consumer stress built up since 2022 has been partially absorbed and partially deferred but not resolved. Sustained improvement across multiple quarters is needed before optimism is warranted.
The U.S. Bankcard Market Has Split in Two. Prime and non-prime consumers are sharply diverging trajectories. Prime cardholders are deleveraging and paying down debt, while non-prime cardholders are carrying balances 50% higher than four years ago, with payment rates that have collapsed by 760 basis points over the same period. Aggregate industry statistics increasingly obscure in this divide.
Minimum Credit Payment is a Critical Warning Signal. The share of prime cardholders making only the minimum payment has nearly doubled since 2022, reaching roughly 1 in 10. For non-prime cardholders, it's 1 in 4. Consumers making only minimum payments are not reducing debt; they are watching balances grow through interest accrual and remain perpetually one financial shock away from default.
Credit Limit Contraction is Tightening the Rope. Overall bankcard credit limits have contracted 11% since their 2022 peak, actively reducing financial flexibility for borderline borrowers. As limits fall while balances stay elevated, utilization rises and available credit shrinks, a dynamic that disproportionately harms the most financially vulnerable consumers.
Q1 Improvements May Be Seasonal, Not Structural. The modest recovery in payment rates and delinquency metrics in Q1 2026 coincides with IRS tax refund season, suggesting EITC disbursements are providing temporary relief rather than signaling a durable turnaround. April and May data will be the real test of whether these improvements have legs beyond the refund window.
The Macro Environment: A Prolonged Financial Squeeze For Non-Prime Cardholders
The consumer stress visible in Q1 2026 portfolio data is the product of a prolonged macroeconomic squeeze. Approximately 1 in 10 prime cardholders and 1 in 4 non-prime cardholders are making only the minimum payment required each month. For non-prime cardholders, a group that tends to have thinner savings buffers, fewer financial alternatives, and greater sensitivity to economic shocks; this is not merely a portfolio risk metric. They are a window into the financial fragility of some of America's most vulnerable consumers. These are households that are one unexpected expense, one job disruption, or one interest rate shock away from falling into delinquency, and the data suggests their numbers are still growing.
The bifurcation between prime and non-prime portfolios has widened to a degree that makes aggregate industry statistics increasingly misleading. Prime consumers are deleveraging, carrying lower balances, and paying down debt, while non-prime consumers are carrying 50% more debt than they were four years ago, with payment rates that have collapsed by 760 basis points over the same period. The credit card market is not a single market. It is two markets, moving in opposite directions, with very different consequences for the consumers caught in each.
Credit Limits are Declining
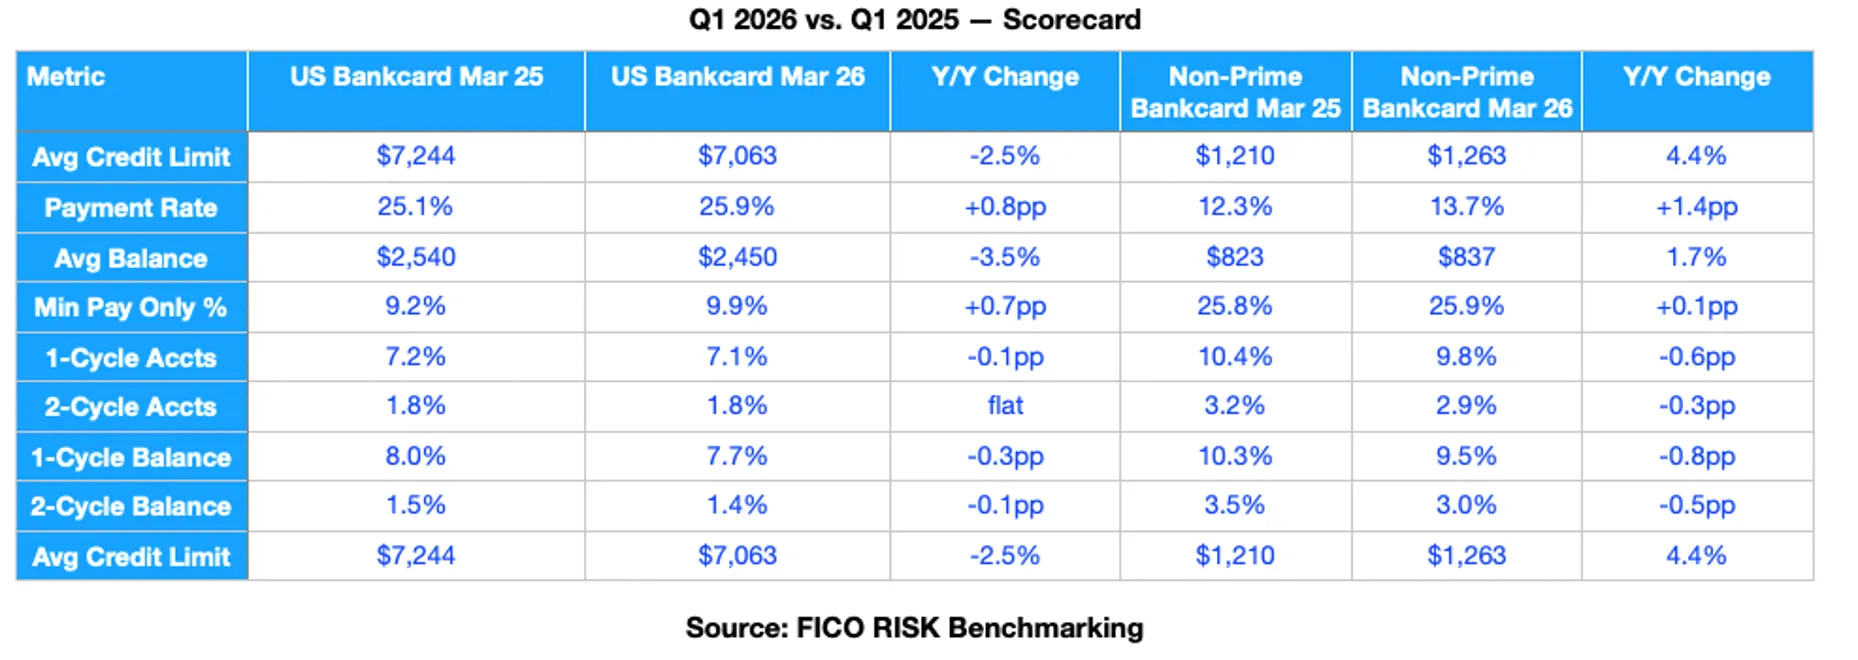
From a peak of approximately $7,938 in January 2022, limits fell to $7,063 by March 2026, an 11% contraction over four years. The December year-end comparison confirms the trajectory: $7,685 in December 2023, $7,317 in December 2024, and $7,091 in December 2025, a year-over-year decline of 3.1%. In Q1 2026, January came in at $7,070 (down 2.8% vs. January 2025's $7,272) and March closed at $7,063 (down 2.5% vs. March 2025's $7,244).
In today's high-rate climate, issuers find the need to protect themselves — but consumers often end up paying the price. When credit limits fall and balances remainelevated, available credit shrinks, utilization rates rise, and the financial flexibility of borderline borrowers diminishes further. The limit of contraction is not a neutral event; it is an active tightening of the financial rope.
In contrast, non-prime average credit limits have been gradually expanding, rising from a trough of approximately $1,112 in late 2022 to $1,263 by March 2026, a gain of roughly 13.6% over the same period that Bankcard limits contracted. March 2026 non-prime limits represent a 4.4% increase versus March 2025. This selective expansion at controlled per-account ticket sizes suggests issuers are deliberately managing their per-account exposure while still growing subprime origination volumes.
Payment Rates in Decline since 2022
From a peak of 30.7% in May 2022, the rate fell to 25.0% by December 2025, a decline of 570 basis points, and the lowest level in the dataset. In Q1 2026, the payment rate improved modestly: March recovering to 25.9%, up 0.8pp versus March 2025's 25.1%. This represents a tentative but encouraging sequential improvement heading into spring 2026.
The connection to the macro environment here is direct. Payment rates peaked in mid-2022, precisely the moment when pandemic-era savings buffers were most intact and before the Fed's rate hikes had fully propagated into consumer borrowing costs. As the rate hiking cycle took hold, disposable income available to pay credit card debt was progressively redirected toward higher debt-service costs across all consumer credit products, mortgages, auto loans, and revolving credit alike. With inflation simultaneously eroding real purchasing power, the ability of consumers to pay down balances deteriorated structurally, not episodically.
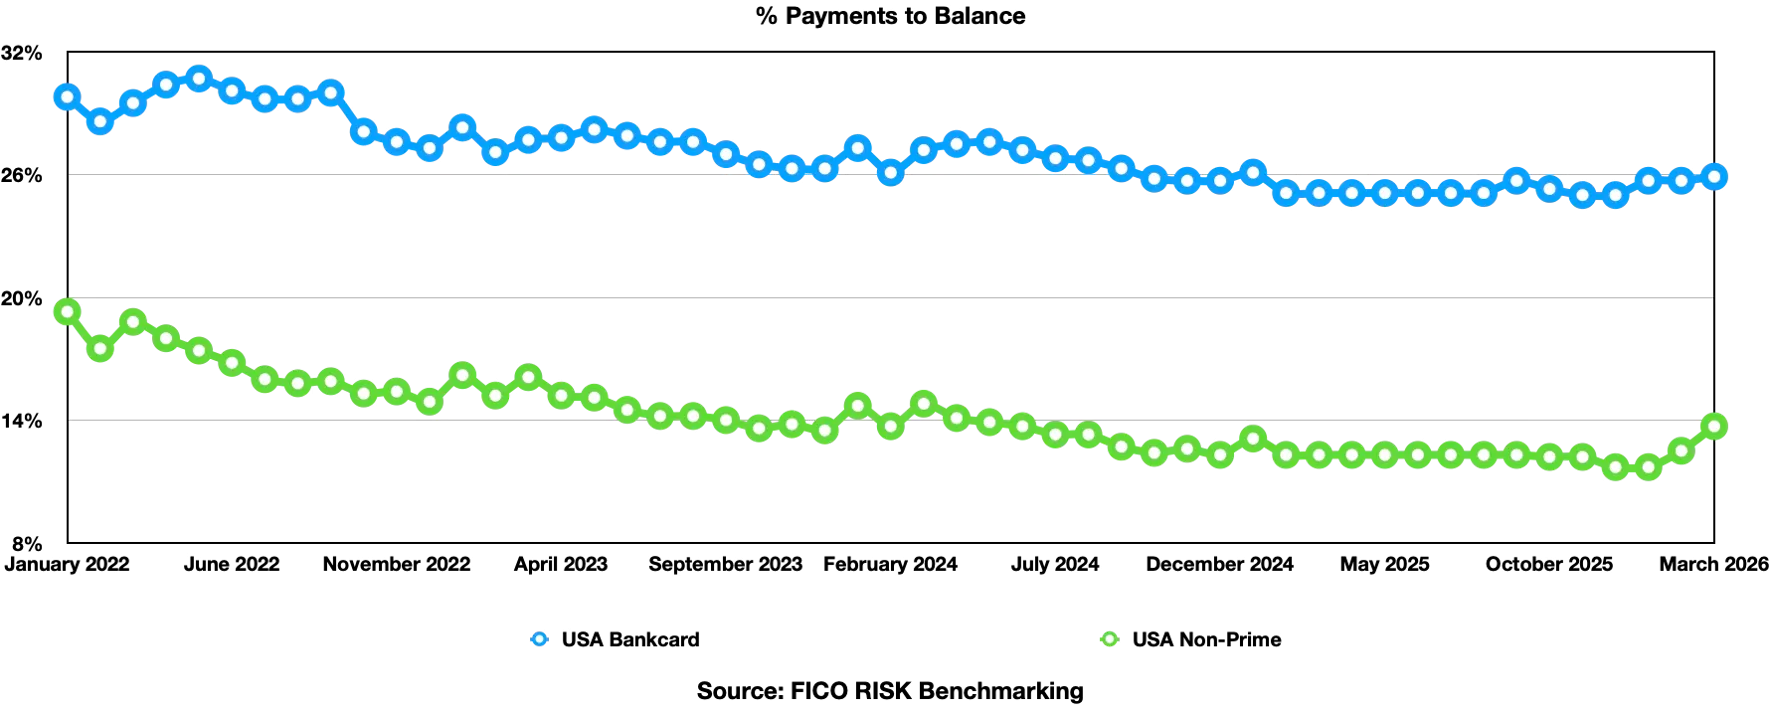
The non-prime payment rate collapse has been even more pronounced, falling from 19.3% in January 2022 to 11.7% in December 2025 and January 2026, a 760-basispoint drop. January 2026 at 11.7% is 1.4 percentage points below January 2025's 13.1%, though February and March 2026 show modest recovery, with March up 1.4pp year-over-year to 13.7%, the most meaningful non-prime payment rate improvement in over two years.
The March improvement in payment rates, most pronounced in the Non-Prime segment, coincides with peak IRS tax refund disbursement season, suggesting that EITC proceeds may be providing temporary relief to the most financially stretched cardholders, though April and May data will be critical in determining whether the recovery has legs beyond the refund window
Minimum Payments Have Nearby Doubled Since 2022
This is the most consequential metric in the dataset, and the most urgent signal for the health of the U.S. consumer credit ecosystem. The share of active Bankcard accounts has increased from 5.3% to 10.4% by December 2025. In Q1 2026, the rate continues to climb: January at 9.8% (up 0.8pp vs. January 2025's 9.0%) and March at 9.9% (up 0.7pp vs. March 2025's 9.2%). Since March 2022, this rate has risen by 74%. 1 in 10 prime cardholders is now making only the minimum payment each month, a figure that would have been considered alarming just three years ago and has now become the new baseline. The non-prime minimum payment picture is even more striking. Throughout the entire observation period, roughly 1 in 4 non-prime cardholders have been making only the minimum payment. December 2025 came in at 26.4%, matching December 2024 exactly, and Q1 2026 is tracking at 25.9%, essentially flat year-over-year. While the absence of further deterioration is a modest positive, the absolute level is deeply concerning. These are consumers who are not reducing their debt; they are servicing it at the bare minimum, watching their balances grow month after month through interest accrual, and remaining perpetually one financial shock away from default.
The implications extend well beyond portfolio loss rates. Non-Prime cardholders making only minimum payments represent a segment of the consumer population with characteristics that make them acutely vulnerable to broader economic disruptions: limited liquid savings, high debt-service-to-income ratios, minimal credit flexibility, and few alternative sources of liquidity. When economic conditions deteriorate, through job loss, medical expense, or an interest rate of shock, these consumers have no buffer. The transition from minimum payment to missed payment, and from missed payment to charge-off, is often rapid and severe in this cohort. With 1 in 4 non-prime consumers already at this threshold, the portfolio of exposure to macro deterioration is significant and should not be underestimated.
Average Balances are Increasing
After rising for 24 consecutive months, the average Bankcard balance peaked at $2,681 in April 2024 and has since declined, reaching $2,450 by March 2026. The Q1 year-over-year comparison shows consistent contraction: March 2026 at $2,450 vs. $2,540 in March 2025, down 3.5%. The December 2025 year-end balance of $2,499 compares to $2,585 in December 2024, a 3.3% decline.
The non-Prime average balance has moved in the opposite direction throughout the observation period, rising from $562 in January 2022 to $838 by December 2025 and to $846 by January–February 2026, a 50% increase over four years. December year-end balances tell the same story: $613 (Dec-22), $690 (Dec-23), $752 (Dec-24), $838 (Dec-25), and a 11.4% year-over-year increase in 2025 alone. In Q1 2026, growth is showing early signs of moderating, with March at $837 vs. $823 a year ago (+1.7%).
Severe Delinquencies are Rising
Two-cycle delinquency, representing the most severe end of the delinquency spectrum and the most direct precursor to charge-off, has been on a sustained upward trajectory, nearly doubling from 1.1% in January 2022 to 2.1% in January 2026. The December year-end progression is stark: 1.5% (Dec-22), 1.7% (Dec-23), 1.8% (Dec-24), and 2.0% (Dec-25). In Q1 2026, March came in at 1.8%, flat with March 2025, the first month without a year-over-year increase in this metric in over two years.
Non-Prime two-cycle delinquency rose from 2.4% (Mar-22) to a peak of 3.3% (Dec-25), before easing to 2.9% in March 2026, down 0.3pp year-over-year. This improvement mirrors the broader non-prime delinquency picture in Q1 2026.
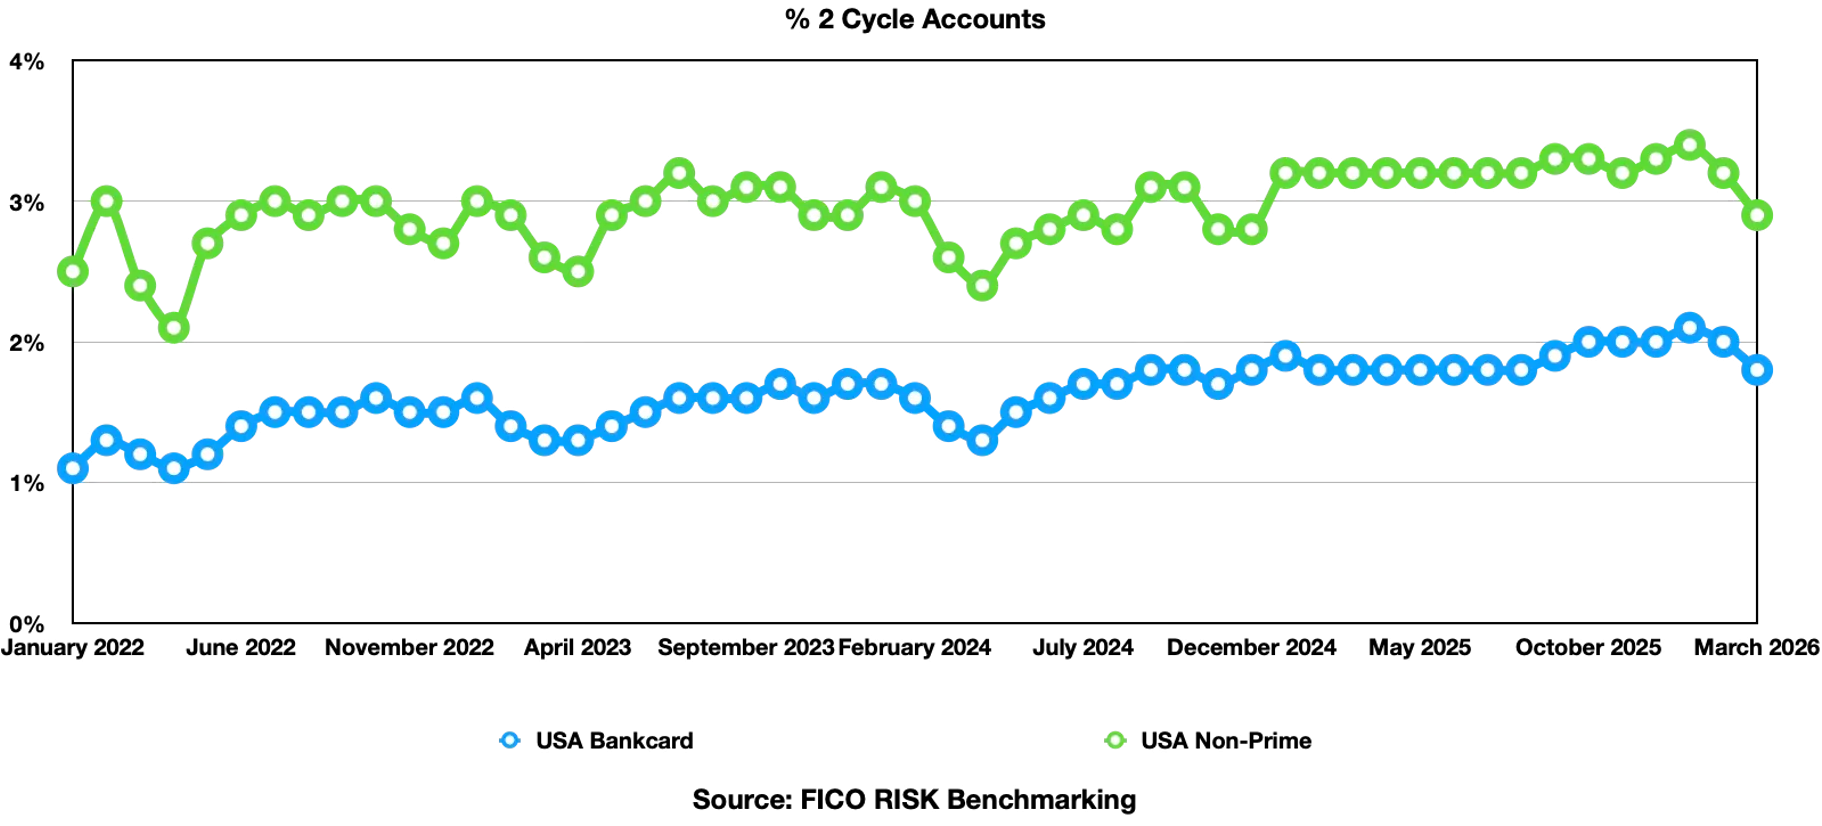
Two-cycle balance delinquency has doubled since early 2022, from 0.8% to 1.6%, though the pace of increase is somewhat slower than the unit measure. March 2026 at 1.4% is marginally improved vs. March 2025's 1.5%.
The near-doubling of two-cycle delinquency over four years in the Bankcard segment represents a fundamental deterioration in portfolio quality that has not yet fully reversed. The tentative plateauing visible in Q1 2026 is encouraging, but it needs to be sustained over multiple periods, and the minimum payment trajectory cautions against premature optimism.
It is also worth noting that Q1 delinquency improvements historically correlate with tax refund season, as EITC disbursements provide a critical, if temporary, financial lifeline to the lower-income households most represented in the non-prime delinquency cohort.
The Q1 2026 scorecard is cautiously constructive on delinquency; both Bankcard and Non-Prime delinquency metrics are broadly flat to modestly improved year-over-year, the best collective reading since 2022. Non-Prime, counterintuitively, is showing larger improvements than Bankcard across almost every delinquency measure. Payment rates are recovering at the margin. These are genuine positives. But minimum payment behavior continues to rise in the Bankcard segment; non-primebalances remain near record highs, and the structural vulnerabilities in both portfolios, built up over four years of rising stress, will not resolve in a single quarter.
The Bottom Line: A Fragile Stabilization in a Challenging Rate Environment
The US bankcard market enters mid-2026 with the first signs of stabilization in delinquency. Yet the underlying consumer stress that drove the acute deterioration of 2022 through 2024 has not been resolved. It has been partially absorbed, partially deferred, and in the non-prime segment, substantially deepened. With 1 in 4 non-prime consumers making only minimum payments and carrying balances 50% higher than four years ago, that segment remains acutely exposed to any worsening in the macroeconomic environment. These consumers are a barometer of financial stress among the Americans with the least margin for error, and right now, that barometer remains firmly in the warning zone.
How FICO Can Help You Manage Credit Card Risk and Performance:
- Explore our solutions for customer management.
- Make more informed and profitable decisions with FICO’s Scoring Solutions.
- Download our executive brief to learn more about agile credit card limit management
- Read our case study to understand how Bradesco partnered with FICO to modernize credit decisioning and auto loan pricing
Frequently Asked Questions
The stress visible in bankcard portfolios is part of a broader pattern across consumer credit. Research from the New York Fed's Liberty Street Economics found that auto loan delinquency rates have risen across virtually all credit score bands and income levels, with the most pronounced deterioration concentrated in loans originated by non-captive auto finance companies, which tend to serve lower-credit-score borrowers. By Q2 2025, the auto loan 60+ days past due rate had reached 1.49%, surpassing 2009 levels, though the pace of year-over-year growth has begun to slow federalreserve.gov. For unsecured personal loans, the picture is modestly more encouraging: the 60+ DPD delinquency rate stood at 3.37% in Q2 2025, marking the third consecutive quarter of year-over-year improvement, driven in part by better performance in the subprime segment. Taken together, these trends confirm that bankcard stress does not exist in isolation; it reflects a broad post-pandemic normalization of consumer credit risk across multiple product categories.
Consumer credit stress is not evenly distributed across the country. Research published by the Federal Reserve Bank of Boston found that credit card delinquency rates vary meaningfully by region, with New England consumers generally faring better than those in the rest of the country — a gap the authors attribute partly to higher average incomes and education levels in the region. Importantly, the same research found that income is a stronger driver of delinquency risk than geography: regardless of region, cardholders with annual household income below $50,000 show significantly higher delinquency and revolving rates than higher-income groups, and the average balance on delinquent accounts has risen fastest for lower-income cardholders.
The Federal Reserve's Spring 2025 Financial Stability Report noted that delinquencies on credit cards and auto loans remain above pre-pandemic levels, particularly for borrowers with non-prime credit scores, a large share of whom have low to moderate incomes. For issuers managing exposure in this segment, the implication is that traditional, static underwriting approaches are insufficient. Research published by the Federal Reserve Board found that the key predictors of credit card delinquency rates include the prime rate, the unemployment rate, the level of real revolving debt, tightening credit standards, and the share of non-prime balances in a portfolio. Issuers who monitor these variables dynamically — using updated credit scores, behavioral payment data, and macroeconomic signals — and provide tools such as hardship programs and dynamic credit limit management are better positioned to identify accounts showing early signs of deterioration before they reach delinquency.
The Federal Reserve Board has identified a set of macroeconomic variables that are most predictive of credit card delinquency rates: the prime rate, the unemployment rate, the level of real revolving credit balances, the tightening of credit card underwriting standards, and the share of non-prime balances in the portfolio. Of these, unemployment is particularly consequential: a sustained increase in unemployment would quickly erode the payment capacity of the non-prime borrowers who are already making only minimum payments. In practical terms, lenders should watch post-tax-season payment rate trends closely: if the modest Q1 2026 improvements in payment rates and delinquency do not hold through Q2 and Q3 (once the EITC refund effect fades) it would suggest the stabilization is seasonal rather than structural.

Popular Posts

Has the Reporting of Rental Data to the Credit Reporting Agencies (CRAs) Increased?
FICO Score 10T includes rental data, but consumers can only experience the benefit of this to the extent that their rental data is reported to the CRAs
Read more
Average U.S. FICO® Score at 716, Indicating Improvement in Consumer Credit Behaviors Despite Pandemic
The FICO Score is a broad-based, independent standard measure of credit risk
Read more
FICO Statement on FHFA and FHA Updates to Credit Score Modernization
FICO supports FHFA’s announcement that the long-anticipated historical data for FICO® Score 10T will be released to the mortgage market.
Read moreTake the next step
Connect with FICO for answers to all your product and solution questions. Interested in becoming a business partner? Contact us to learn more. We look forward to hearing from you.