Analyzing the GSE Historical Data: Key Considerations in the Evaluation of Credit Scores
Before drawing conclusions from the GSE dataset, it's important to understand how truncation, population selection, and metric choice can shape and even distort results

The release of FICO® Score 10T historical loan-level data by the Government Sponsored Enterprises (GSEs), Fannie Mae and Freddie Mac, marks a pivotal moment in the mortgage industry’s credit score modernization effort. For the first time, stakeholders in the mortgage industry have access to nearly 50 million conforming mortgage loans spanning more than a decade of originations, with performance data for Classic FICO® Score, FICO® Score 10T, and VantageScore 4.0 side by side.
As analysts begin assessing credit score performance using this rich dataset, it’s worth highlighting several considerations that can meaningfully shape what this data shows — and what it doesn't.
The 620 Floor: Understanding the Impact of Truncation
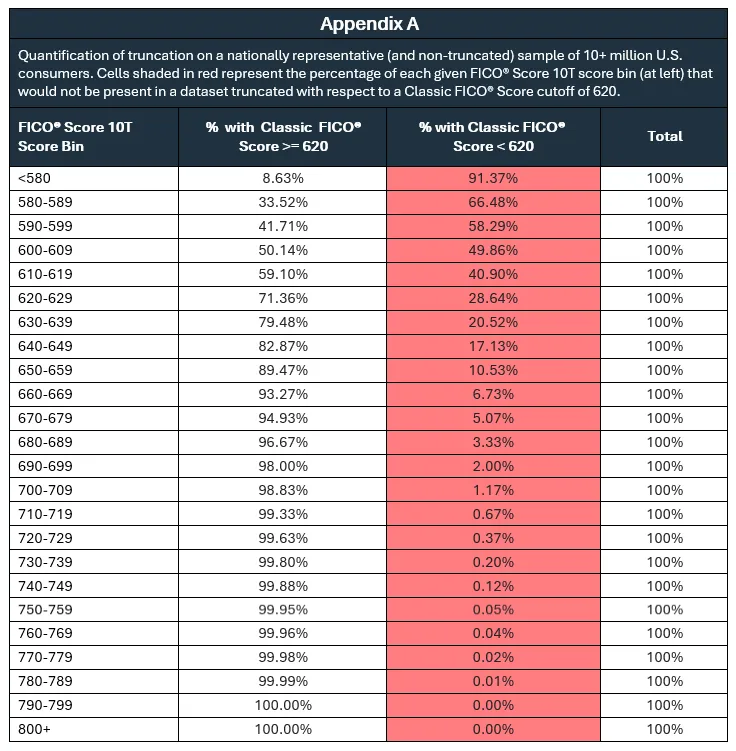
The GSE dataset is a valuable resource, but it comes with a built-in limitation that every analyst should understand before reaching conclusions about score performance. Because the GSEs have historically utilized a Classic FICO® Score cutoff of 620 for loan approval, the dataset is truncated: virtually all applicants whose Classic FICO Score was below 620 are absent from the data. This includes those applicants who have FICO® Score 10T or VantageScore 4.0 scores that may have otherwise been above the relevant score cutoff.
This truncation matters because it disadvantages the incumbent score in a head-to-head validation. When evaluating competing models within a population selected using the incumbent score, the resulting truncation can significantly understate the incumbent model's predictive strength — a dynamic we have previously referred to as “home-court disadvantage.” In some cases, truncation can reduce measured performance of the incumbent score by as much as 15%.
Truncation can also impact the calibration of the relationship between an incumbent score and a new score with respect to expected default rate, particularly in the lower score ranges where it is most prevalent. In those lower score ranges, more of the true ‘through the door’ applicant population — those who would qualify under a non-incumbent challenger score but whose Classic FICO® Score fell below 620 — are excluded from the analysis entirely, understating risk in those lower score bins for the challenger score. Appendix A quantifies the potential impact of truncation at the 620 cutoff on FICO® Score 10T.
It is worth noting that this effect may be even more pronounced in comparisons involving VantageScore 4.0. FICO® Scores and VantageScores are not equivalent and have fundamentally different design blueprints. Therefore, unlike FICO® Score 10T, which shares significant design continuity with Classic FICO® Score, a larger share of VantageScore 4.0-qualified applicants may be systematically absent from the truncated dataset, thereby amplifying the potential for inaccurate conclusions.
“Lies, Damned Lies, and Statistics”
There is a related form of truncation that should be avoided, which we have previously addressed and is just as relevant to analyses of the GSE data. Analyzing the relative performance of a benchmark (in this case, Classic FICO® Score) and challenger scores on a population defined by the benchmark score significantly truncates the benchmark score in the comparison and disadvantages the benchmark score relative to any challenger score being evaluated. This in turn can materially overstate gains attributed to the challenger score.
Put another way: beware of any validation results claiming significant lift of a challenger score over a benchmark score where the population analyzed was defined as borrowers with a benchmark score below 720, or within a range such as 680-739. Applying that kind of population filter to the GSE data compounds an already truncated dataset, which can lead to further biasing of the results against the benchmark score. Any fair and robust score comparison will minimize benchmark-defined truncation wherever possible.
Measuring Outcomes Consistently
The GSE dataset contains 12 years of information on conforming mortgages, covering the origination periods 2013 through 2025. This data includes both the borrower profile as of the time these loans were originated, as well as the subsequent repayment history on each of these loans through the end of 2025. When comparing the relative effectiveness of credit scores across this range of vintages, using a consistent outcome measure is essential.
The study design specified by the GSEs as measures for accuracy and reliability assessment of credit scores models within the Joint Enterprise Credit Score Solicitation (see page 10) indicated use of a 24-month, 90+ days past due performance outcome. That is a logical measure for use in the mortgage originations setting, and consistent with the outcome measure used in the time-tested FICO® Score development blueprint.
We have seen some examples of practitioners utilizing an “ever default” outcome measure when analyzing the GSE data. The challenge is straightforward: comparing score performance on a 2013 vintage vs. a 2023 vintage using “ever default” means the 2013 vintage analysis examines predictive effectiveness of the score over as much as a 12-year outcome window, whereas the analysis on the 2023 vintage covers just two years of subsequent repayment behavior. This can produce confounded results that are not apples-to-apples and should not be directly compared or combined to generate composite performance statistics drawn from inconsistent outcome windows.
We encourage analyses be conducted across multiple outcome windows and vintages to confirm the robustness of score performance over time — with the important caveat that the outcome window be held constant within each comparison.
Cherry-Picked Performance Metrics Require a Second Look
The Joint Enterprise Credit Score Solicitation did not only articulate a specific outcome window to be used in the Enterprises’ score accuracy and reliability assessments, it also identified the key performance metrics the GSEs would use in evaluating the scores. Page 14 of the solicitation highlights three well-established and widely used metrics for evaluating score predictive accuracy: the Gini coefficient, the Kolmogorov-Smirnov (K-S) statistic, and “bad capture in the lowest scoring tail” (often translated as the performance of the score in the lowest scoring decile of the population).
So when an analysis instead leads with an unfamiliar metric, it is worth asking why. This kind of selective “metric shopping” raises a reasonable question about whether the result was chosen because it is genuinely important to the usage of the score, or because it is the one that yielded the most favorable results in the eyes of the author. A credible comparison reports a full range of results on well-established performance measures and population segments rather than isolating a single metric or segment or time period that tells the best story.
Stress? What stress?
The GSE dataset spans more than a decade of conforming mortgage originations from 2013 to 2025 — a relatively benign period in the U.S. macroeconomy. Understanding credit score performance in stable conditions matters, but it may be even more critical to understand score dynamics and performance during periods of economic stress.
The one period of macroeconomic stress that is covered by the GSE data is the onset of the COVID-19 pandemic. Unlike prior stress events, where both onset and recovery unfolded over quarters if not years, the effects of COVID-19 were sudden and dramatic — and were quickly followed by unprecedented public and private sector intervention, including the CARES Act forbearance mandate. It is easy to make the case that consumer behavior data from this period is confounded and needs careful interpretation.
In Sum
FICO is very pleased that the FICO® Score 10T historical loan-level data has now been published, which will enable the entire mortgage industry to confirm what the GSEs have already concluded: that FICO Score 10T is the most predictive score among those approved for use by the GSEs.
Whether you are running the analysis yourself or consuming some of the many analyses using this same data that will undoubtedly be published in the days and weeks ahead, be sure to keep the considerations outlined here in mind. Truncation effects, score-based population selection, and outcome window consistency all bear directly on how results should be interpreted — and on the confidence that can reasonably be placed in any given set of findings.
We look forward to sharing our own analysis of this data in the days ahead. As the mortgage industry utilizes this data to better understand how FICO® Score 10T can expand access for borrowers while supporting a more resilient housing finance system, we welcome questions or the opportunity to discuss findings. Please don’t hesitate to reach out to the FICO Mortgage and Capital Markets team at mortgageinfo@fico.com.

Popular Posts

Average U.S. FICO® Score at 716, Indicating Improvement in Consumer Credit Behaviors Despite Pandemic
The FICO Score is a broad-based, independent standard measure of credit risk
Read more
The GSE Data Is Public. Here's What It Shows About Credit Score Modernization.
Independent Milliman analysis of GSE historical data confirms what anyone can now verify directly: FICO® Score 10T is the most predictive score.
Read more
FICO Statement on FHFA and FHA Updates to Credit Score Modernization
FICO supports FHFA’s announcement that the long-anticipated historical data for FICO® Score 10T will be released to the mortgage market.
Read moreTake the next step
Connect with FICO for answers to all your product and solution questions. Interested in becoming a business partner? Contact us to learn more. We look forward to hearing from you.