Canada Bankcard Industry Benchmarking Trends: Q2 2025
Credit card insights uncover developing financial pressures affecting many Canadians

Over the past two years, Canadian credit card performance has exhibited remarkable stability in aggregate measures, masking significant stress within specific borrower segments. Bank-issued credit cards have shown resilience, while monoline credit products—serving predominantly younger and underbanked consumers—have experienced notable deterioration in payment behavior and rising delinquencies.
Key Takeaways:
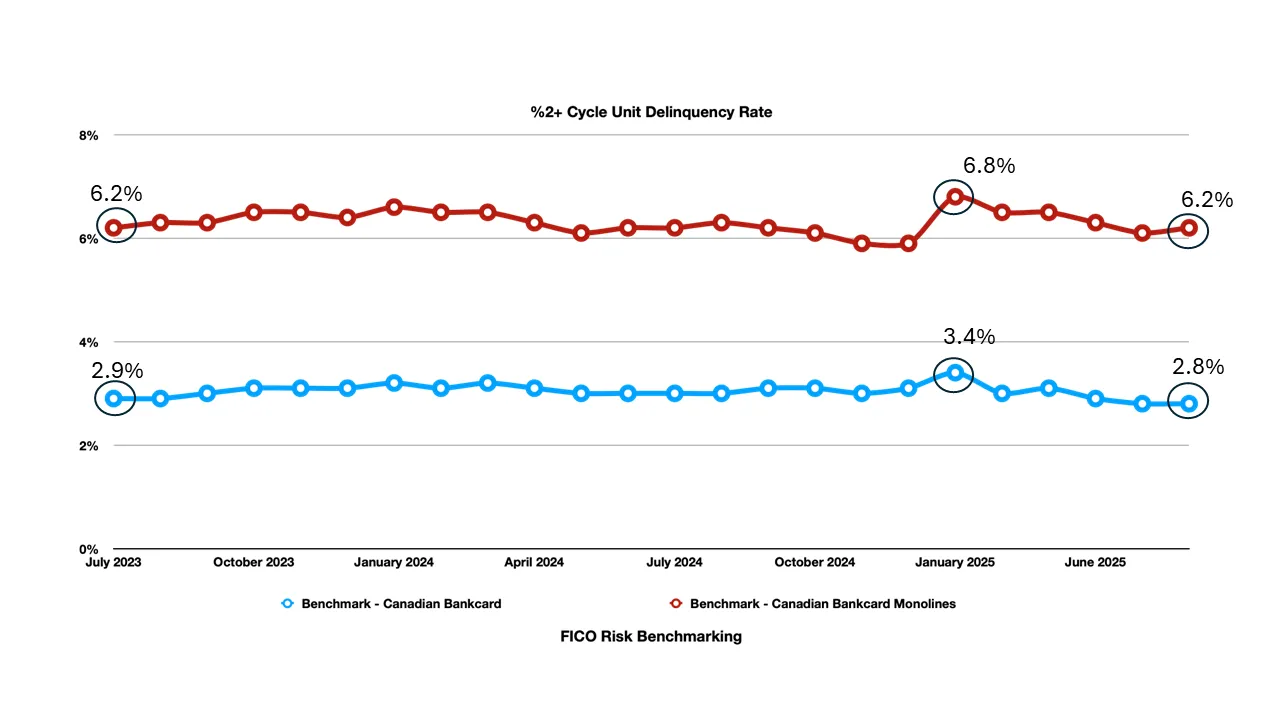
Delinquency Divergence: Monoline 2+ cycle delinquencies peaked at 6.8% in January 2025, representing a five-year high, while bank cards remained stable around 3%
Payment Pressure Intensifying: Payment-to-balance ratios declined across both segments, with bank cards dropping from 55% to 47-53% range
Credit Access Expansion: Credit limits for new accounts grew substantially, with bank cards increasing from $5,647 to $6,344 (+12%) and monoline limits rising from $4,068 to $4,884 (+20%)
Utilization Stability: Despite payment pressures, utilization rates remained relatively stable, suggesting consumers are managing available credit carefully
The Erosion of Post-Pandemic Discipline - Bank Cards See Gradual Decline from Stability
Bank credit card payment-to-balance ratios have shown a steady but measured decline over the 24-month period. Starting at 55% in July 2023, payment rates experienced seasonal fluctuations but settled into a concerning pattern by 2025:
Mid-2023: 55% payment rates, reflecting strong post-pandemic financial discipline.
Early 2024: Sharp drop to 48-49% during Q1, indicating seasonal stress.
Mid-2025: Stabilization around 52-53%, representing a permanent reset lower.
This 2-3 percentage point decline represents thousands of dollars in reduced monthly payments across the Canadian banking system, suggesting consumers are increasingly managing cash flow by carrying higher balances.
What the Numbers Mean:
55% starting point: For every $1,000 in balance, consumers were paying $550/month
47.3% low point: Same consumers now paying only $473/month on $1,000 balance
$77 reduction: Per $1,000 balance represents significant cash flow shift
Seasonal pattern: Q1 consistently shows weakest payment performance (holiday spending aftermath)
Why This Matters:
System-wide impact: With millions of cardholders, this 2-3% decline represents billions in reduced monthly payments
Cash flow management: Indicates consumers prioritizing liquidity over debt reduction
Interest revenue: Banks benefiting from longer balance carry periods
Monoline Cards: Persistent Payment Pressure
The monoline segment tells a more dramatic story of financial constraint. Payment rates that began at an already-low 33.8% have deteriorated further:
2023 Average: 32.5% payment-to-balance ratio
2024 Volatility: Wide swings between 29% and 37%, indicating irregular payment patterns
2025 Trajectory: Stabilizing around 31%, representing a meaningful reduction in repayment capacity.
The 10+ percentage point gap between bank and monoline payment rates highlights the fundamental difference in financial health between these customer segments.
What This Reveals About Financial Stress
Liquidity crisis: Customers prioritizing other expenses (rent, food, utilities)
Survival mode: Only making minimum or near-minimum payments
Debt spiral risk: With such low payments, balances can easily grow
Economic pressure: External factors (job loss, reduced hours) impacting payment ability
This volatility pattern isn't just a statistical curiosity—it's a window into the financial lives of Canada's most economically vulnerable credit card users, showing how external pressures translate into payment behavior and ultimately, credit risk.
Delinquency Trends - Stability Masks Underlying Stress: While 2+ cycle delinquency rates appear stable at the surface level, the underlying dynamics reveal important shifts:
Bank Cards:
Maintained remarkable consistency between 2.8% and 3.4%
Seasonal patterns remain predictable.
January 2025 spike to 3.4% quickly normalized.
Current levels around 2.8-2.9% suggest strong risk management
Monoline Cards: significantly higher baseline rates (6.0-6.8% range).
More volatile month-to-month performance
January 2025 peak of 6.8% marked a concerning high-water mark
Recent stabilization around 6.1-6.3% still represents elevated risk
The persistent 2-3x higher delinquency rates in the monoline segment underscore the concentration of credit risk among underbanked populations.
Why This Shows "Stressed Borrower Segment" -
Customer Demographics:
Younger borrowers: Limited credit history, lower incomes
Credit builders: People rebuilding after past financial difficulties
Underbanked: Limited access to traditional banking relationships
Thin-file consumers: Insufficient credit history for prime lending
Economic Vulnerability:
Higher sensitivity to economic shocks
Limited financial cushions/emergency funds
Often single-income households or gig economy workers
Less access to family financial support systems
Credit Access and Utilization - Expansion Amid Caution
New account credit limits have grown substantially across both segments:
Bank Cards:
July 2023: $5,647 average limit
June 2025: $6,344 average limit
12.3% increase over 24 months
Monoline Cards:
July 2023: $4,068 average limit
June 2025: $4,884 average limit
20.1% increase over 24 months
The faster growth in monoline limits suggests either competitive pressure in the subprime market or efforts to support struggling borrowers with additional capacity.
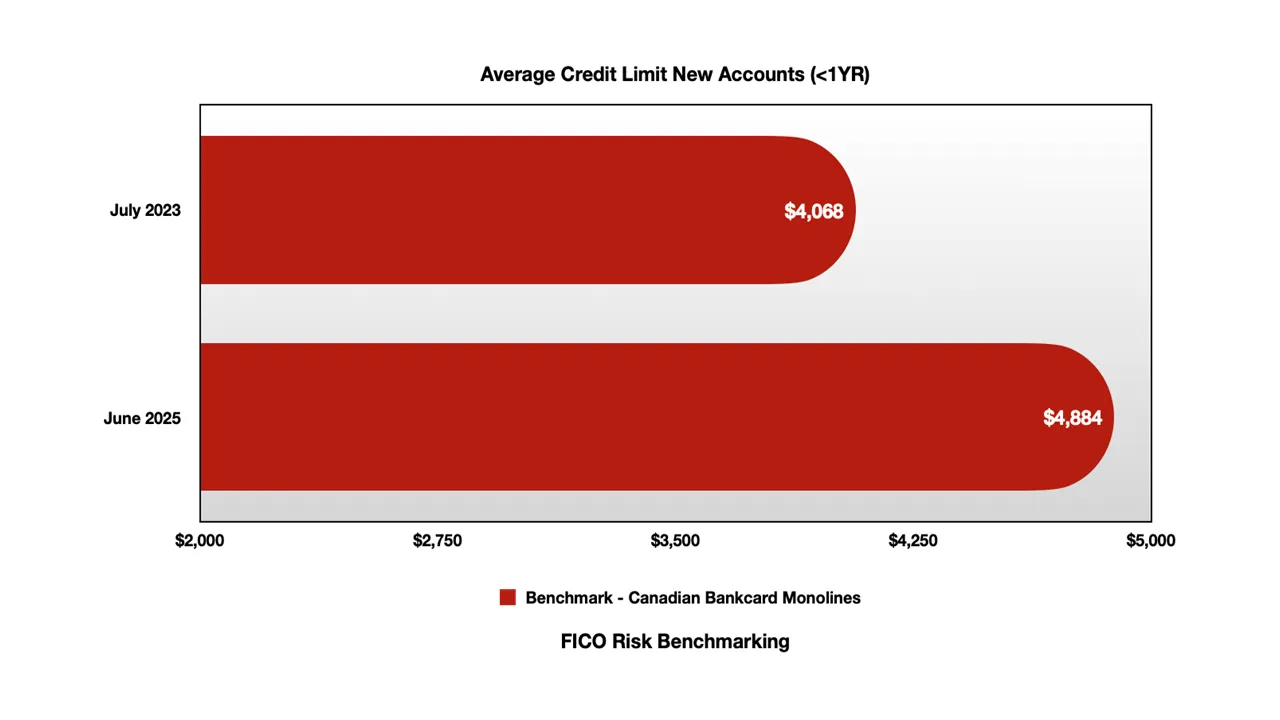
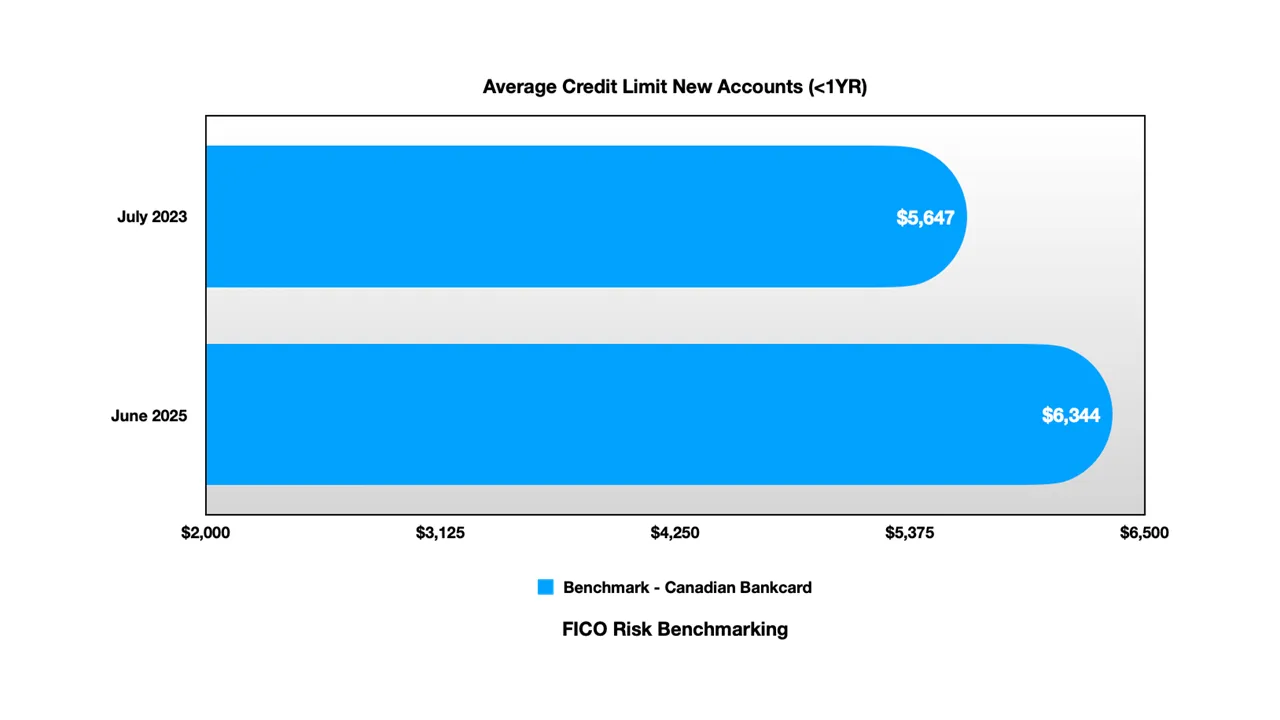
What Credit Expansion Means
Risk-based pricing: Monoline customers getting smaller initial limits but faster growth
Competitive pressure: 20% monoline growth vs 12% bank growth suggests market competition
Risk management: Both segments expanding but maintaining risk differential
Utilization Rates - Surprising Stability: Despite payment pressures, credit utilization rates have remained remarkably stable:
Bank Cards: Consistent 28-29% utilization throughout the period
Monoline Cards: Higher but stable 38-39% utilization rates
This stability, combined with growing credit limits, suggests that balance growth has been accommodated through expanded credit capacity rather than higher utilization of existing limits.
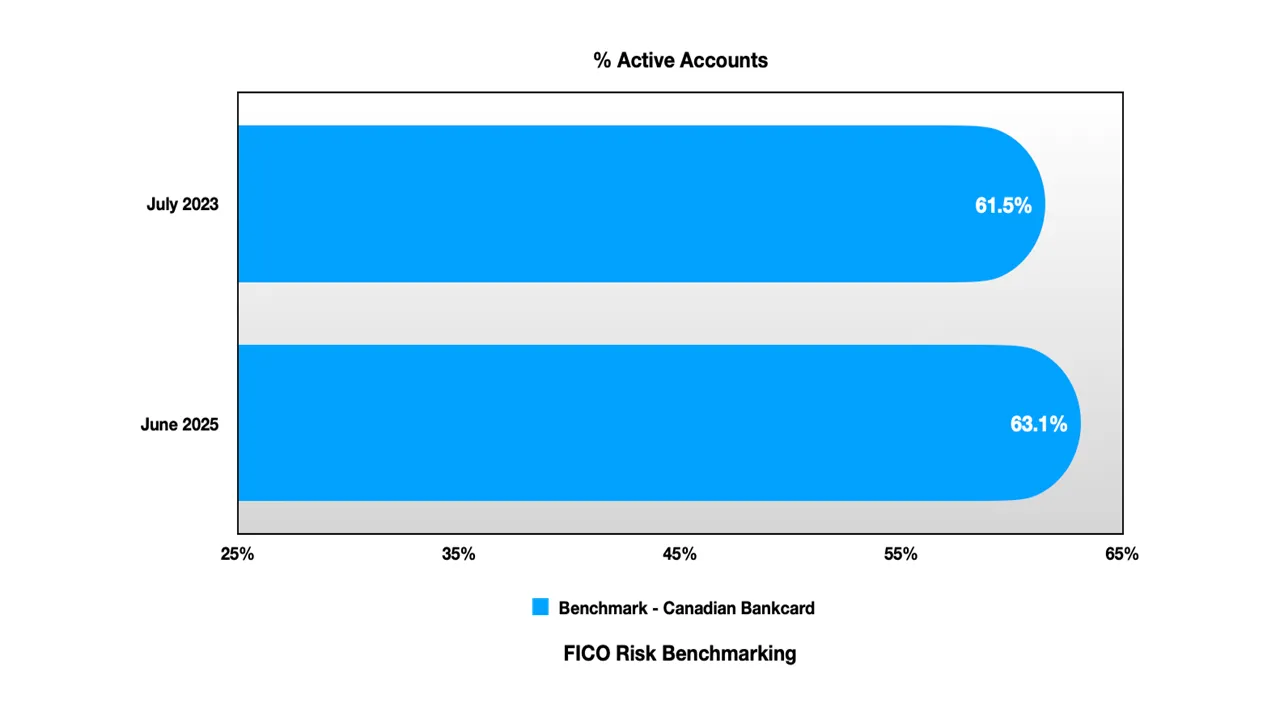
Account Activation - Rising Engagement Among Vulnerable Segments: One of the most significant trends has been the increase in account activation rates, particularly in the monoline segment:
Bank Cards:
Stable 61-63% activation rates throughout the period
Slight uptick to 63% by mid-2025
Monoline Cards:
Notable increase from 53-54% to 58-59%
Represents increased reliance on credit products among underbanked consumers
This trend suggests that economic pressures are driving higher engagement with credit products among populations with limited alternative financial resources.
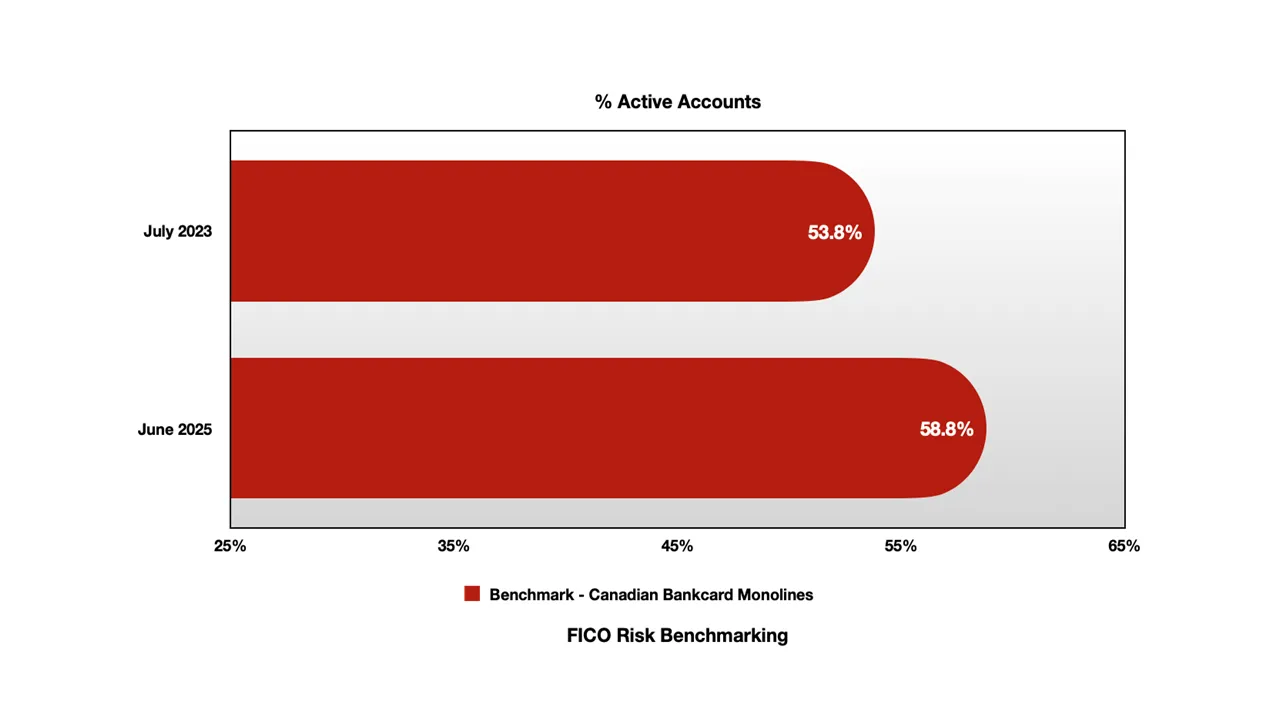
Activity Rate Implications:
Bank cards: Slight increase suggests stable customer engagement
Monoline surge: 5-point increase indicates economic pressure driving usage
Gap narrowing: From 7.7 point gap to 4.3 point gap (convergence)
Timing significance: 2025 acceleration coincides with payment ratio declines
Balance Dynamics - Modest Growth Amid Payment Pressure: Balance growth has been surprisingly modest given the payment rate declines:
Bank Cards:
July 2023: $3,112 average balance
June 2025: $3,234 average balance
3.9% increase over 24 months
Monoline Cards:
July 2023: $2,980 average balance
June 2025: $3,116 average balance
4.6% increase over 24 months
Genuine Consumer Restraint Despite Inflation: Average balances grew only 3.9% (bank cards) and 4.6% (monoline) over 24 months—despite inflationary pressures during this period—demonstrating active spending discipline as consumers absorbed inflationary pressures without proportional debt increases.
Looking Forward: Key Trends to Monitor
Early Warning Indicators
Payment Rate Trajectories: Further declines below 50% (banks) or 30% (monolines) would signal acute stress
Delinquency Volatility: Increased month-to-month swings in monoline performance could indicate portfolio instability
Credit Limit Growth: Continued rapid expansion may indicate defensive lending to prevent defaults
Utilization Rate Breaks: Any significant increase from current stable levels would suggest consumer desperation
Conclusion: Stability Masking Segmented Stress
The Canadian credit card market from mid-2023 to mid-2025 tells a story of aggregate stability masking significant segmented stress. While traditional bank credit card relationships demonstrate remarkable resilience, the monoline segment faces mounting pressures that reflect broader economic challenges affecting younger and underbanked consumers.
How FICO Can Help You Manage Credit Card Risk and Performance:
Explore our solutions for customer management.
See my previous posts on CA card performance.
Make more informed and profitable decisions with FICO’s Scoring Solutions.

Popular Posts

Has the Reporting of Rental Data to the Credit Reporting Agencies (CRAs) Increased?
FICO Score 10T includes rental data, but consumers can only experience the benefit of this to the extent that their rental data is reported to the CRAs
Read more
Average U.S. FICO Score at 717 as More Consumers Face Financial Headwinds
Outlier or Start of a New Credit Score Trend?
Read more
Average U.S. FICO® Score at 716, Indicating Improvement in Consumer Credit Behaviors Despite Pandemic
The FICO Score is a broad-based, independent standard measure of credit risk
Read moreTake the next step
Connect with FICO for answers to all your product and solution questions. Interested in becoming a business partner? Contact us to learn more. We look forward to hearing from you.